Date: Fri Oct 19 2012 - 11:18:55 MDT
Hello,
As I stated yesterday, instead of passing in 5 values per box as the
documentation states is required, you are passing in 365 values. The box
plot function wants 5 values in ascending order as is stated in the
documentation and as is shown in example #1 here:
http://www.ncl.ucar.edu/Applications/box.shtml#ex1
Modifying some coding from example #1 to simplify it:
yval = new((/2,5/),"float",-999.)
yval(0,0) = -3.
yval(0,1) = -1.
yval(0,2) = 1.5
yval(0,3) = 4.2
yval(0,4) = 6.
yval(1,0) = -1.
yval(1,1) = 0.
yval(1,2) = 1.
yval(1,3) = 2.5
yval(1,4) = 4.
wks = gsn_open_wks("ps","box")
x = (/-3., -1./)
plot = boxplot(wks,x,yval,False,False,False)
Note that for box #1 and #2, the values are increasing within the yval
(0,:) and yval(1,:) arrays. The boxplot function simply plots boxes
given the input y array values /in the order they are present in the y
array/.
I am not sure what the data in the file you attached is supposed to
represent:
9.75 24 9.375 9 8.25 5.25 12.375 24 11.625
4.125 14.625 12 10.125 8.625 11.25 12 12.375 11.625
7.5 17.625 12.375 8.625 13.5 10.5 10.875 17.25 12
9.375 24.375 9.375 9.375 17.25 13.125 22.5 13.875 9.375
6.75 23.25 11.25 11.25 11.25 11.25 29.625 19.875 16.125
3.75 28.5 10.125 8.625 14.25 10.5 21.75 16.5 6
4.5 26.625 9.375 5.625 10.5 9.375 13.875 14.25 13.125
4.875 13.875 12.375 6 12.75 14.625 18.375 18.375 10.875
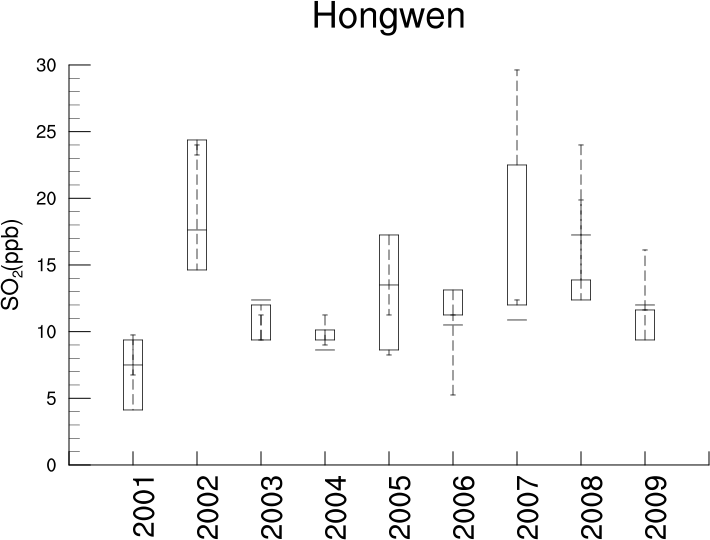
I ran your code on the input data, and I got the plot that I attached.
Looking at your input data/coding, you are passing these values in as
box #1: 9.75, 4.125, 7.5, 9.375, and 6.75. Looking at the first box plot
in the attached box.png, those values are the ones that are being used
to draw the box. If you wanted boxplot to draw each boxplot as you
desire, you would have to input the values /in ascending order/. For
instance, box #1's values would have to be 4.125, 6.75, 7.5, 9.375, and
9.75.
Please look at boxplot example #1 and try modifying/running it so you
can further understand how the boxplot function works. Adam
On 10/18/2012 09:17 PM, nlcheng wrote:
> I have uploaded the script and the data .
> When I run the script it turns out the drawing of boxplot like
> this
> but the box is in a mess ; not
> I do not know what is wrong!
> hope for your help!
>
>
>
>
>
>
> _______________________________________________
> ncl-talk mailing list
> List instructions, subscriber options, unsubscribe:
> http://mailman.ucar.edu/mailman/listinfo/ncl-talk
--
______________________________________________________________
Adam Phillips                                asphilli@ucar.edu
NCAR/Climate and Global Dynamics Division       (303) 497-1726
P.O. Box 3000
Boulder, CO 80307-3000    http://www.cgd.ucar.edu/cas/asphilli
_______________________________________________
ncl-talk mailing list
List instructions, subscriber options, unsubscribe:
http://mailman.ucar.edu/mailman/listinfo/ncl-talk