Date: Fri Oct 19 2012 - 00:58:25 MDT
Hello,
I used GDL (an IDL alternative) programs to read multiple MODIS swaths over
a specified domain during 1 day period, and generated a binary file with a
2D gridded array (0.1 deg resolution) by averaging all valid MODIS pixels
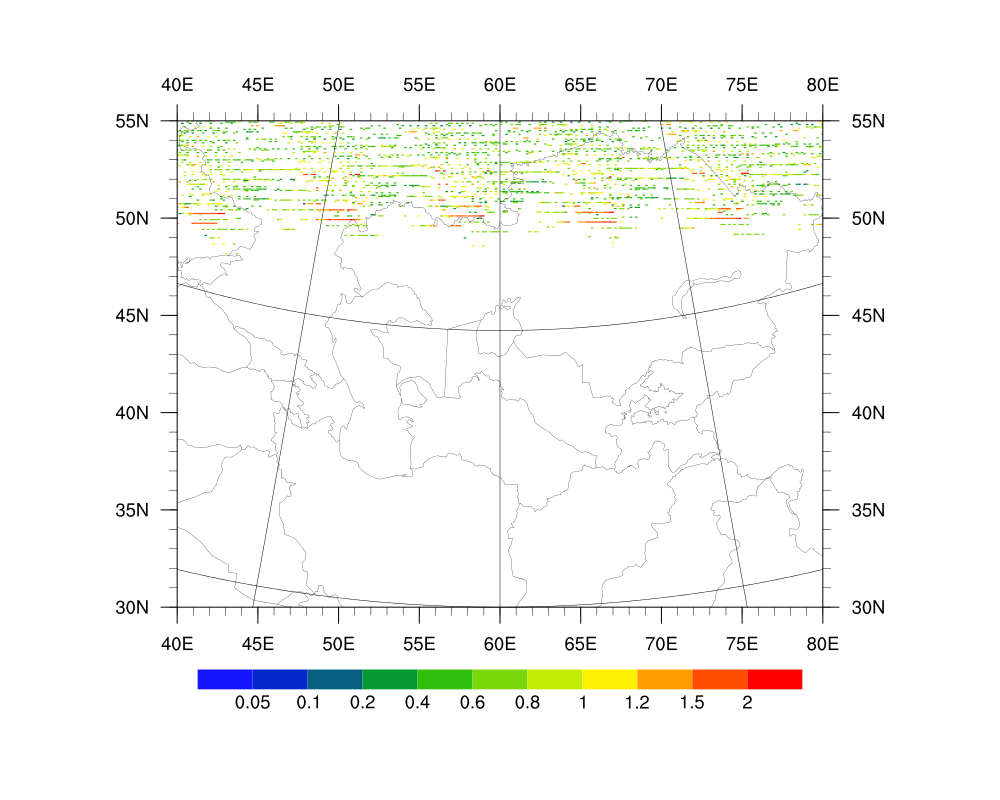
within each 0.1x0.1 grid cell. (Due to a plotting issue on my GDL
installation,) I then use NCL to read the binary file, and plot the
dataset, but got wrong result. I donot know where I did wrong, and would
appreciate it if anyone can point it out for me. Thanks!
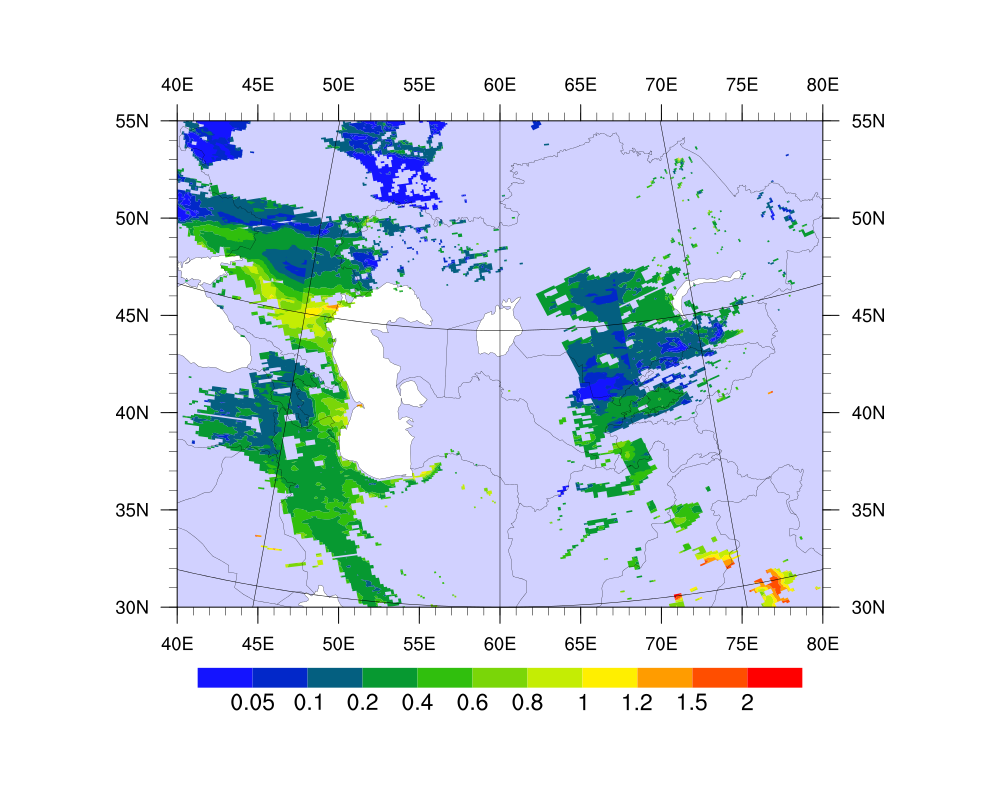
I attached the figure with multiple MODIS swaths and the plot result from
the binary (which is wrong); and the NCL script used to read and plot the
binary file.
begin
data_dir = "/media/cdata1/data/modis_daily_2d/"
files = systemfunc("ls "+data_dir+"aod550_2009181*")
nfiles = dimsizes(files)
latN = 55.0
latS = 30.0
lonL = 40.0
lonR = 80.0
resolution = 0.1
ncols = floattoint((lonR-lonL)/resolution)
nrows = floattoint((latN-latS)/resolution)
lon1d = fspan(lonL+resolution/2,lonR-resolution/2,ncols)
lat1d = fspan(latS+resolution/2,latN-resolution/2,nrows)
lon1d@units = "degrees_east"
lat1d@units = "degrees_north"
aod550 = new((/ncols,nrows/),float)
tmp = new((/nfiles,ncols,nrows/),float)
tmp@_FillValue = -999.9
do i = 0, nfiles-1
print("Reading file: "+files(i))
tmp(i,:,:) = fbindirread(files(i),0,(/ncols,nrows/),"float")
end do
aod550 = dim_avg_n(tmp,0)
aod550_std = dim_stddev_n(tmp,0)
aod550!0="lon"
aod550!1="lat"
aod550&lon=lon1d
aod550&lat=lat1d
printVarSummary(aod550)
print(max(aod550))
print(min(aod550))
;====================================
outfile = "mm"
type = "newpng"
wks = gsn_open_wks(type, outfile)
gsn_define_colormap(wks,"wh-bl-gr-ye-re");"rainbow+gray")
res = True
res@gsnMaximize = True
res@gsnFrame = False
res@gsnDraw = False
res@cnFillOn = True
res@cnFillMode = "CellFill"
res@cnLinesOn = False
res@cnLineLabelsOn = False
res@cnLevelSelectionMode = "ExplicitLevels"
res@cnLevels = (/.05,.1,.2,.4,.6,.8,1.0,1.2,1.5,2.0/)
res@gsnSpreadColors = True
res@gsnSpreadColorStart = 48
res@gsnSpreadColorEnd = -1
res@trGridType = "TriangularMesh"
res@lbLabelAutoStride = True
res@lbLabelFontHeightF = 0.012
res@lbBoxLinesOn = False
res@pmLabelBarWidthF = 0.55
res@pmLabelBarHeightF = 0.06
res@pmLabelBarOrthogonalPosF = 0.1
res@mpDataBaseVersion = "MediumRes"
res@mpOutlineBoundarySets = "AllBoundaries"
res@mpNationalLineThicknessF = 0.5
res@mpGeophysicalLineThicknessF = 0.5
res@tmYRLabelsOn = True
res@tmXTLabelsOn = True
res@tmXBLabelFontHeightF = 0.012
res@tmXBTickSpacingF = 5
res@tmYLTickSpacingF = 5
res@tmXBMode = "Explicit"
res@tmXBMinorValues = ispan(40,80,1)
res@tmYLMode = "Explicit"
res@tmYLMinorValues = ispan(30,55,1)
res@mpFillOn = False
res@tfDoNDCOverlay = True
res@gsnAddCyclic = False
res@mpProjection = "CylindricalEquidistant"
res@mpLimitMode = "LatLon"
res@mpMinLatF = latS
res@mpMaxLatF = latN
res@mpMinLonF = lonL
res@mpMaxLonF = lonR
res@mpGridAndLimbOn = True
res@mpCenterLonF = 60.0
res@mpCenterLatF = 42.0
plot = gsn_csm_contour_map(wks,aod550,res)
draw(plot)
frame(wks)
_______________________________________________
ncl-talk mailing list
List instructions, subscriber options, unsubscribe:
http://mailman.ucar.edu/mailman/listinfo/ncl-talk