Date: Wed Oct 31 2012 - 14:22:10 MDT
Hi NCL,
I followed the http://www.ncl.ucar.edu/**Applications/<http://www.ncl.ucar.edu/Applications/>
(http://www.ncl.ucar.edu/Applications/Scripts/daymet_2.ncl) for Daymet
data, and I found problems, actually the file name should be
prcp.2010_12100.nc.
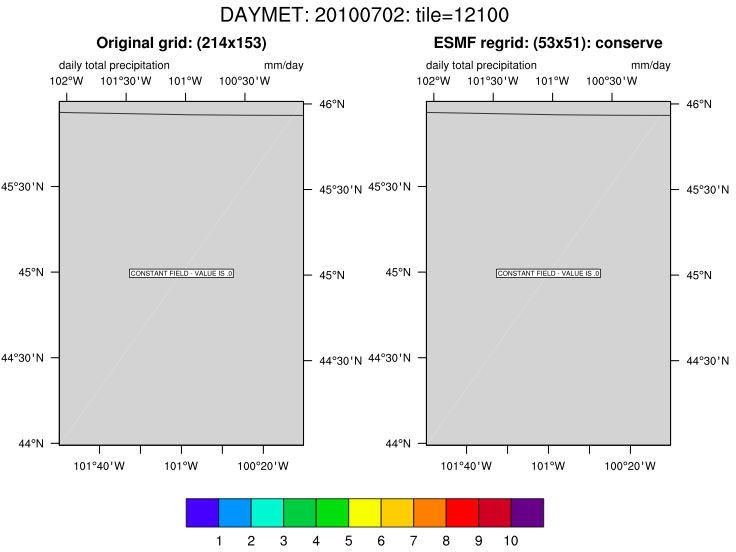
*I didn't see the **dstFile generated *and the plotting is wrong:
[image: Inline image 1]
The
There were warning information:
warning:ContourPlotInitialize: scalar field is constant; ContourPlot not
possible:[errno=1102]
warning:ContourPlotSetValues: Data values out of range of levels set by
MANUALLEVELS mode
warning:ContourPlotInitialize: scalar field is constant; ContourPlot not
possible:[errno=1102]
warning:ContourPlotSetValues: Data values out of range of levels set by
MANUALLEVELS mode
I also have questions on the code creating the destination grid:
;---Create the destination lat/lon grid
NLAT = nlat/4 ; 4 is arbitrary
MLON = mlon/3 ; 3 is arbitrary
lat = fspan( min(lat2d),max(lat2d),NLAT)
lon = fspan( min(lon2d),max(lon2d),MLON)
Opt@DstGridType = "rectilinear"
Opt@DstGridLat = lat
Opt@DstGridLon = lon
I saw the number 4 and 3 are arbitrary, why? If I plan to regrid this 1 KM
to 4 KM, are they should be
*nlat/2 *and *mlon/2*?
Looking forward to hearing from you.
Regards,
Ping
> On Wed, Oct 31, 2012 at 2:09 PM, Dennis Shea <shea@ucar.edu> wrote:
>
>> Dave [, Ping,]
>>
>> http://www.ncl.ucar.edu/**Applications/<http://www.ncl.ucar.edu/Applications/>
>>
>> Click Daymet under Datasets
>>
>> Comments?
>>
>> D
>>
>>
>>
>>
>> On 10/30/12 3:51 PM, Ping Yang wrote:
>>
>>> Dear NCL,
>>>
>>> I installed a new version of gcc and located the library directory to
>>> DYLD_LIBRARY_PATH, and now it the libgomp.1.dylib issue went away. Thank
>>> you so much.
>>>
>>> Can you have a look at this script(Regrid a curvilinear grid from 1km to
>>> rectilinear grid at 4km, I was trying to find an example on NCL website,
>>> but there is one regriding from WRF grid to the same resolution and
>>> another template regridding to 1 degree, so I intended to compile them
>>> together):
>>>
>>> load "$NCARG_ROOT/lib/ncarg/**nclscripts/csm/gsn_code.ncl"
>>> load "$NCARG_ROOT/lib/ncarg/**nclscripts/csm/gsn_csm.ncl"
>>> load "$NCARG_ROOT/lib/ncarg/**nclscripts/csm/contributed.**ncl"
>>> load "$NCARG_ROOT/lib/ncarg/**nclscripts/wrf/WRFUserARW.ncl"
>>> load "$NCARG_ROOT/lib/ncarg/**nclscripts/esmf/ESMF_**regridding.ncl"
>>> begin
>>>
>>> *;---Data file containing source grid*
>>> * src_file = "~/Data/Daymet_NE_20100418_**prcp.nc" *
>>> * sfile = addfile(src_file,"r")*
>>> * dst_file = "~/Data/Daymet_NE_20100418_**Regridded_prcp.nc"*
>>> * dfile = addfile(dst_file,"c")*
>>> *;---Get variable to regrid*
>>> * varname = "prcp" *
>>> * var = sfile->$varname$*
>>> * src_lat = sfile->lat ;;---Change (maybe)*
>>> * src_lon = sfile->lon ;;---Change (maybe)*
>>> *;---Set up regridding options*
>>> * Opt = True*
>>> * Opt@SrcFileName = src_file ; Name of source and*
>>> * Opt@DstFileName = dst_file ; destination files*
>>> *;---"bilinear" is the default. "patch" and "conserve" are other
>>> options.*
>>> * Opt@InterpMethod = "bilinear"*
>>> * Opt@WgtFileName = "~/Data/curv_to_3minute.nc
>>> <http://curv_to_3minute.nc>"*
>>> *
>>> *
>>> * Opt@SrcGridLat = src_lat ; source grid*
>>> * Opt@SrcGridLon = src_lon*
>>> * Opt@SrcRegional = True ;;--Change (maybe)*
>>> * Opt@DstRegional = True*
>>> *
>>> *
>>> * newlon = fspan(-84.025,-64.875,384)*
>>> * newlat = fspan(34.875,50.125,306)*
>>> *
>>> *
>>> *;---Create the destination lat/lon grid*
>>> *; lat = fspan( 53.2420, 85.4022,nlat)*
>>> *; lon = fspan(135.7750,258.1880,nlon)*
>>> *
>>> *
>>> * Opt@DstGridType = "rectilinear"*
>>> * Opt@DstGridLat = newlat*
>>> * Opt@DstGridLon = newlon*
>>> *
>>> *
>>> * Opt@SrcRegional = True*
>>> * Opt@DstRegional = True*
>>> *
>>> *
>>> * Opt@ForceOverwrite = True*
>>> * Opt@PrintTimings = True*
>>> * Opt@Debug = True*
>>> **
>>> * var_regrid = ESMF_regrid(var,Opt) ; Do the regridding*
>>> * printVarSummary(var_regrid)*
>>> *
>>> *
>>> *;----------------------------**------------------------------**
>>> ------------*
>>> *; Plotting section*
>>> *;*
>>> *; This section creates filled contour plots of both the original*
>>> *; data and the regridded data, and panels them.*
>>> *;----------------------------**------------------------------**
>>> ------------*
>>> * var@lat2d = src_lat ; Needed for plotting.*
>>> * var@lon2d = src_lon*
>>> *
>>> *
>>> * wks = gsn_open_wks("pdf","curv_to_**3min")*
>>> * xwks = gsn_open_wks("x11","curv_to_**3min")*
>>> *
>>> *
>>> * res = True*
>>> *
>>> *
>>> * res@gsnMaximize = True*
>>> *
>>> *
>>> * res@gsnDraw = False*
>>> * res@gsnFrame = False*
>>> *
>>> *
>>> * res@cnFillOn = True*
>>> * res@cnLinesOn = False*
>>> * res@cnLineLabelsOn = False*
>>> * res@cnFillMode = "RasterFill"*
>>> *
>>> *
>>> * res@lbLabelBarOn = False ; Turn on later in panel*
>>> *
>>> *
>>> * res@mpMinLatF = min(src_lat)*
>>> * res@mpMaxLatF = max(src_lat)*
>>> * res@mpMinLonF = min(src_lon)*
>>> * res@mpMaxLonF = max(src_lon)*
>>> *
>>> *
>>> *;;--Change (likely)*
>>> *; res@cnLevelSelectionMode = "ManualLevels"*
>>> *; res@cnMinLevelValF = 0*
>>> *; res@cnMaxLevelValF = 200*
>>> *; res@cnLevelSpacingF = 10*
>>> *
>>> *
>>> *;---Resources for plotting regridded data*
>>> * res@gsnAddCyclic = False ;;---Change (maybe)*
>>> * res@tiMainString = "3 min grid (" + Opt@InterpMethod + ")"*
>>> *
>>> *
>>> * plot_regrid_p = gsn_csm_contour_map(wks,var_**regrid(0,:,:),res)*
>>> * plot_regrid_x = gsn_csm_contour_map(xwks,var_**regrid(0,:,:),res)*
>>> *
>>> *
>>> *;---Resources for plotting original data*
>>> * dims = tostring(dimsizes(var))*
>>> * res@gsnAddCyclic = False ;;---Change (maybe)*
>>> * res@tiMainString = "Original curvilinear grid (" + \*
>>> * str_join(dims," x ") + ")"*
>>> *
>>> *
>>> * plot_orig_p = gsn_csm_contour_map(wks,var,**res) *
>>> * plot_orig_x = gsn_csm_contour_map(xwks,var,**res)*
>>> *;---Compare the plots in a panel*
>>> * pres = True*
>>> * pres@gsnMaximize = True*
>>> * pres@gsnPanelLabelBar = True*
>>> *
>>> *
>>> * gsn_panel(wks,(/plot_orig_p,**plot_regrid_p/),(/2,1/),pres)*
>>> * gsn_panel(xwks,(/plot_orig_x,**plot_regrid_x/),(/2,1/),pres)*
>>> *end*
>>>
>>>
>>> The information for the variable to be regrided:
>>> *Variable: x*
>>> *Type: float*
>>> *Total Size: 11613888 bytes*
>>> * 2903472 values*
>>> *Number of Dimensions: 3*
>>> *Dimensions and sizes:[time | 1] x [y | 1872] x [x | 1551]*
>>> *Coordinates: *
>>> * time: [11055.5..11055.5]*
>>> *Number Of Attributes: 6*
>>> * long_name :daily total precipitation*
>>> * units :mm/day*
>>> * coordinates :lon lat*
>>> * _FillValue :-9999*
>>> * valid_range :( 0, 200 )*
>>> * cell_methods :area: sum time: sum*
>>>
>>>
>>> It is running forever without seeing the end. I am not quite
>>> understanding the example on the defining of the resource grid and
>>> destination grid, Is the resource grid of the source file? and also
>>> about the destination grid(is it will generate automatically?) this
>>> seems much complicated comparing to the precious version.
>>>
>>> Looking forward to hearing from you.
>>>
>>> Regards,
>>>
>>> Ping
>>>
>>>
>>>
>>>
>>> ______________________________**_________________
>>> ncl-talk mailing list
>>> List instructions, subscriber options, unsubscribe:
>>> http://mailman.ucar.edu/**mailman/listinfo/ncl-talk<http://mailman.ucar.edu/mailman/listinfo/ncl-talk>
>>>
>>>
>
_______________________________________________
ncl-talk mailing list
List instructions, subscriber options, unsubscribe:
http://mailman.ucar.edu/mailman/listinfo/ncl-talk