Date: Wed Dec 26 2012 - 14:37:22 MST
Hey
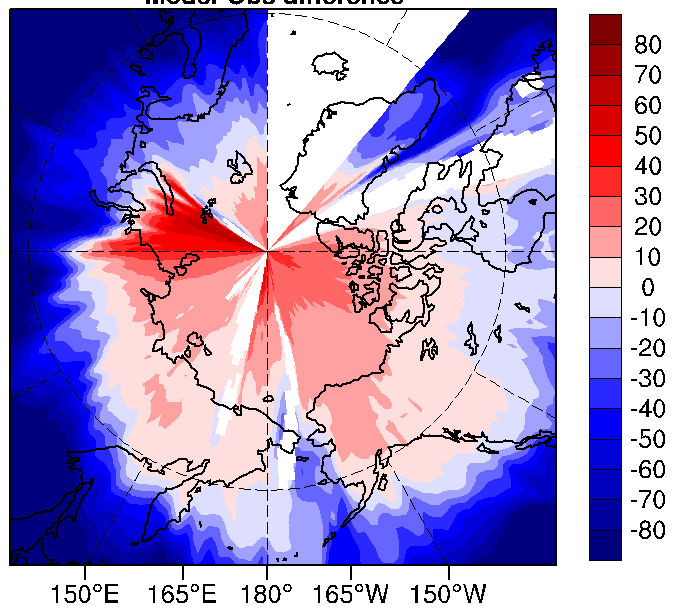
I have a question regarding plotting the data which is supposed to be only
over the oceans. For some reason my plot gets messed up (you can look at
it). I was thinking of assigning the variable (SSH) lats and lons, but I
don't know how to do that given the data has no lats and lons as variables
(only as dimensions). below you find the file info, script and plot. Thank
you!
ncdump - h:
netcdf \1992-2002MDOT060401.gx1v6 {
dimensions:
nlon = 320 ;
nlat = 384 ;
variables:
float SSH(nlat, nlon) ;
SSH:missing_value = 1.e+30f ;
SSH:long_name = "Maximenko/Niiler Sea Surface Height" ;
the script:
load "$NCARG_ROOT/lib/ncarg/nclscripts/csm/gsn_code.ncl"
load "$NCARG_ROOT/lib/ncarg/nclscripts/csm/gsn_csm.ncl"
load "$NCARG_ROOT/lib/ncarg/nclscripts/csm/contributed.ncl"
begin
g = addfile("/import/c/w/asemenov/CESM_plots/obs/
1992-2002MDOT060401.gx1v6.nc","r")
pwv = g->SSH ; sea-ice fraction
;************************************************
wks = gsn_open_wks("x11","Spring")
gsn_define_colormap(wks,"BlWhRe")
res = True
res@gsnFrame = True ; So we can draw markers
res@gsnMaximize = True
res@gsnSpreadColors = True
res@mpGridAndLimbOn = True
res@mpGridLineDashPattern = 2
res@mpGridLineDashPattern = 1
res@mpGeophysicalLineColor = "Black"
res@mpGeophysicalLineThicknessF = 1.5
res@mpNationalLineColor = "Black"
res@mpNationalLineThicknessF = 1.5
res@mpUSStateLineColor = "Black"
res@mpUSStateLineThicknessF = 1.5
res@mpPerimLineColor = "Black"
res@mpDataBaseVersion = "LowRes"
res@cnFillOn = True
res@mpFillColors = (/-1,-1,0,-1/)
res@mpGridLatSpacingF = 30.
res@mpGridLonSpacingF = 30.
res@mpOutlineOn = True
res@tiMainOn = True
res@tiMainPosition = "Center"
res@tiMainFontHeightF = 0.025
res@lbLabelFontHeightF = 0.02
res@gsnPolarLabelDistance = 1.08
res@gsnPolarLabelFontHeightF= 0.02
res@gsnLeftString = " "
res@gsnRightString = " "
res@pmLabelBarDisplayMode = "Always"
res@lbLabelAutoStride = True
res@lbOrientation = "Vertical"
res@lbLabelFontHeightF = 0.025
res@lbPerimOn = False
res@lbAutoManage = False
res@pmTickMarkDisplayMode = "Always"
res@tmXTOn = False
res@tmXBOn = True
res@tmYLOn = False
res@tmYROn = False
res@tmXTLabelFontHeightF = 0.025
res@tmXBLabelFontHeightF = 0.025
res@tmYLLabelFontHeightF = 0.025
res@tmYRLabelFontHeightF = 0.025
; tmres@tmYLValues = (/ 60,70,80 /)
res@tmXBValues = (/ 150., -180., -150. /)
res@tmXBLabelDeltaF = -0.8
res@tmYLLabelDeltaF = -0.8
res@cnLinesOn = False
res@mpProjection = "Stereographic"
res@mpLimitMode = "Corners"
res@mpLeftCornerLatF = 41.0
res@mpLeftCornerLonF = 140.8014
res@mpRightCornerLatF = 44.0
res@mpRightCornerLonF = -50.0
res@mpCenterLatF = 90
res@mpCenterLonF = -180
res@mpFillOn = True
res@cnLevelSelectionMode = "ManualLevels"
res@cnMinLevelValF = -80
res@cnMaxLevelValF = 80
res@cnLevelSpacingF = 10
res@tiMainString = "Sea-surface height, cm~C~Model-Obs
difference"
printVarSummary(pwv)
map = gsn_csm_contour_map(wks,pwv(:,:),res)
end
_______________________________________________
ncl-talk mailing list
List instructions, subscriber options, unsubscribe:
http://mailman.ucar.edu/mailman/listinfo/ncl-talk