Date: Wed Jan 02 2013 - 15:13:52 MST
Hi Abhik (and Adam),
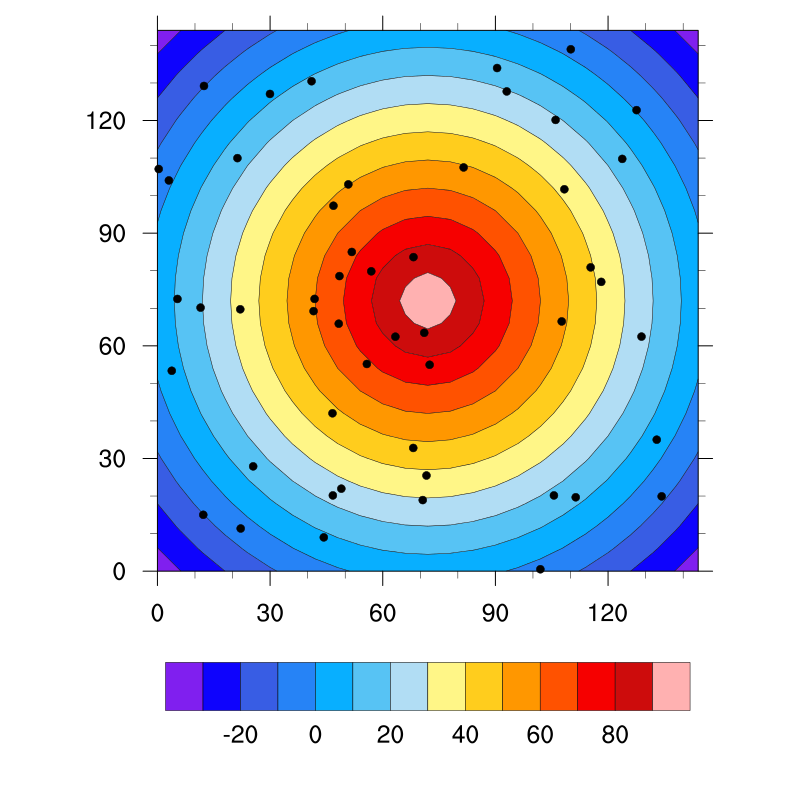
You can overlay an XY plot on a contour plot, as long as they are in the same data space. That is, the X/Y axes for both must overlap at least partially.
See the attached sample script which you can run as-is.
The problem might be that you are deleting plot objects after you overlay them. You don't want to do this, because you are effectively destroying the original plots.
Try commenting out the deletes to see if this works.
>> ; delete(plotz)
>> ; delete(plotx)
--Mary
On Jan 2, 2013, at 10:35 AM, Adam Phillips wrote:
> Hi Abhik,
> It looks like you are trying to overlay a XY plot onto a spatial map
> plot. I would venture to guess that NCL isn't sure how to overlay the 2,
> as the plot types are completely different.
>
> Someone might have a better alternative, but I see two possibilities:
> 1) Create all 6 map plots, call gsn_panel (but don't advance the frame
> by setting gsnFrame = False in the Panel resource list), create all 6 XY
> plots, call gsn_panel, manually advance the frame. You may have to
> adjust the vpWidthF/vpHeightF resources for the XY plots, and you will
> likely have to set gsnPanelXWhiteSpacePercent,
> gsnPanelYWhiteSpacePercent, gsnPanelBottom,gsnPanelTop,gsnPanelRight and
> gsnPanelLeft in the Panel resource lists to try to get things lined up
> correctly.
>
> 2) First create all 6 map plots, call gsn_panel (but don't advance the
> frame by setting gsnFrame = False in the Panel resource list). Draw each
> XY plot individually, exactly specifying the placement over each of your
> 6 map plots via the vpXY/vpYF resources. In this scenario you will want
> to set gsnFrame = False in the xy resource list, and at the end of the
> script call frame(wks)..
>
> I'd recommend trying method 2 first, as even though that method is more
> tedious than the 1st method, you have a higher chance of lining things
> up exactly as you want them..
>
> If you have further questions about this issue please respond to ncl-talk.
> Good luck,
> Adam
>
> On 01/02/2013 01:08 AM, Abhik Santra wrote:
>> Hello ncl-talk,
>>
>> I am trying to make 6 overlay plots in a single panel from two different datasets having different resolutions (1.25x1.25 and 1x1 degrees).
>> But my overlay plots didn't work appropriately as only one set of figures are appeared in the panel.
>>
>> I have the script as follow:
>>
>>
>> begin
>>
>> plot = new(6,graphic)
>> wks = gsn_open_wks("eps","test")
>> gsn_define_colormap(wks,"BlWhRe")
>>
>>
>> do j=0, 5
>>
>> f1 = addfile ("XZ"+j+".nc" , "r") : res: 1.25Dx1.25D
>> f2 = addfile ("X"+j+".nc" , "r") ; res: 1Dx1D
>>
>> z = f1->zz(0,:,:)
>> x = f2->xx(0,:)
>>
>> lon = xx&lon
>>
>>
>> res = True
>> res@cnFillOn = True ; turn on color fill
>> res@gsnDraw = False ; do not draw picture
>> res@gsnFrame = False ; do not advance frame
>> res@lbLabelBarOn = False ; no individual label bars
>> res@gsnSpreadColors = True ; use full colormap
>> res@cnLinesOn = True ; no contour lines
>> res@cnLineThicknessF = 0.6
>> res@cnLineColor = "gray"
>> res@cnInfoLabelOn = False ; turn off cn info label
>> res@cnLevelSelectionMode = "ManualLevels" ; set manual contour levels
>> res@cnMinLevelValF = -0.3 ; set min contour level
>> res@cnMaxLevelValF = 0.3 ; set max contour level
>> res@cnLevelSpacingF = 0.05 ; set contour spacing
>> res@cnLineLabelsOn = False
>> res@tmXBLabelFontHeightF = 0.0
>> res@tmYLLabelFontHeightF = 0.018
>> res@tmYROn = False
>> res@tmYRMinorOn = False
>> res@trYReverse = True
>> res@vpHeightF = 0.2 ; default 0.6
>> res@vpWidthF = 0.8 ; default 0.6
>>
>> plotz = gsn_csm_contour(wks,z,res) ; !! This is only coming in the panel !!
>>
>> xyres = True
>> xyres@gsnDraw = False ; don't draw
>> xyres@gsnFrame = False
>> xyres@tmXTOn = False
>> xyres@tmYLOn = False
>> xyres@tmYROn = True
>> xyres@tmYRLabelsOn = True
>> xyres@trYMinF = -5. ; set Y-axis max and mins
>> xyres@trYMaxF = 5.
>> xyres@gsnYRefLine = 0. ; Y-value for ref. line
>> xyres@xyLineThicknesses = (/3./) ; Define line thicknesses
>> xyres@xyLineColors = (/"black"/) ; Define line color
>> xyres@trXMaxF = 360.
>>
>> plotx = gsn_csm_xy(wks,lon,x,xyres)
>> overlay(plotz,plotx)
>> plot(j) = plotz
>>
>> delete(plotz)
>> delete(plotx)
>> delete(res)
>> delete(xyres)
>> delete(ntim)
>> delete(x)
>> delete(z)
>>
>> j=j+1
>>
>> end do
>> ;*******************************************
>> ; create panel resources
>> ;*******************************************
>> resP = True ; mods desired
>> resP@gsnFrame = False ; save panel until all ready
>> ;resP@gsnMaximize = True ; Maximize in frame
>> resP@gsnPanelBottom = 0.35
>> resP@gsnPanelLabelBar = True ; commom label bar
>> resP@lbLabelStride = 2 ; every 2nd label
>> resP@lbLabelFontHeightF = 0.01
>> resP@pmLabelBarHeightF = 0.06
>> resP@gsnPanelFigureStringsFontHeightF = 0.007
>> resP@pmLabelBarOrthogonalPosF = 0.01
>> resP@gsnAttachPlotsXAxis = True
>> resP@gsnScale = True
>>
>> gsn_panel(wks,plot,(/6,1/),resP) ; create panels
>>
>> frame(wks)
>> end
>>
>> Can anyone suggest me the way to solve this problem?
>> Thanks in advance and wish you a happy new year.
>>
>> Regards,
>> Abhik
>> ______________________________
>> Abhik Santra
>> CSIR Research Fellow,
>> Indian Institute of Tropical Meteorology,
>> Pune - 411008.
>> India
>> _______________________________________________
>> ncl-talk mailing list
>> List instructions, subscriber options, unsubscribe:
>> http://mailman.ucar.edu/mailman/listinfo/ncl-talk
>
> --
> ______________________________________________________________
> Adam Phillips asphilli@ucar.edu
> NCAR/Climate and Global Dynamics Division (303) 497-1726
> P.O. Box 3000
> Boulder, CO 80307-3000 http://www.cgd.ucar.edu/cas/asphilli
>
> _______________________________________________
> ncl-talk mailing list
> List instructions, subscriber options, unsubscribe:
> http://mailman.ucar.edu/mailman/listinfo/ncl-talk
_______________________________________________
ncl-talk mailing list
List instructions, subscriber options, unsubscribe:
http://mailman.ucar.edu/mailman/listinfo/ncl-talk
- application/octet-stream attachment: overlay_test.ncl