Date: Thu Feb 28 2013 - 22:05:01 MST
Thanks Mary,
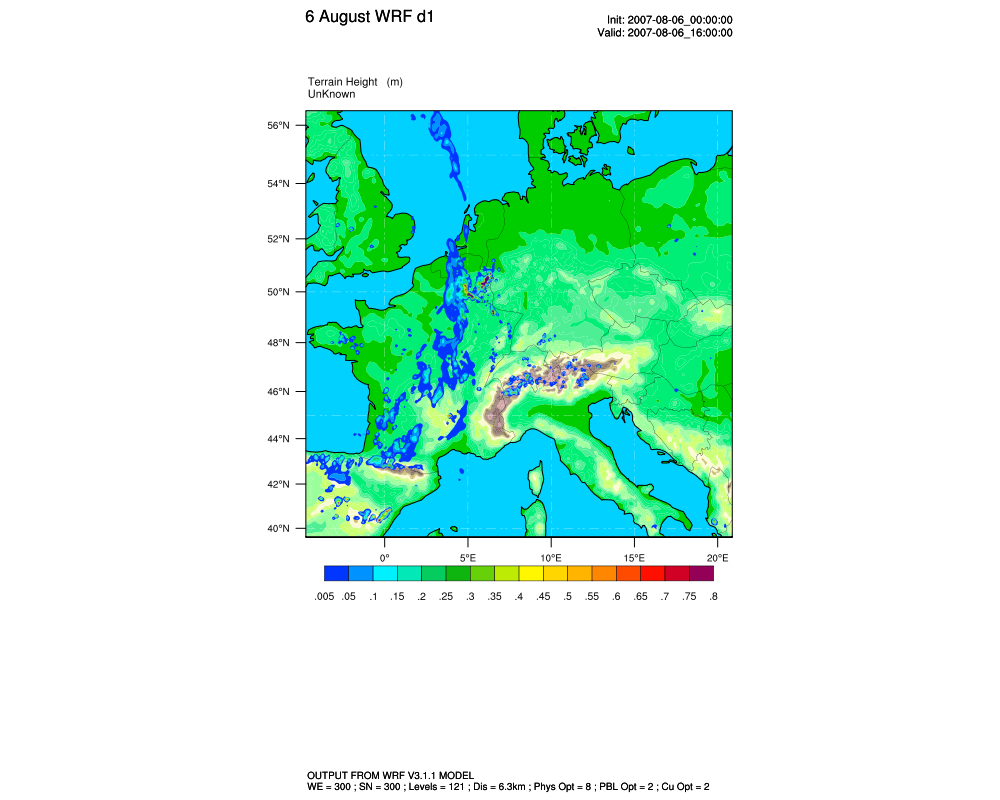
The colorbar explanation makes sense, thanks. I made the 1st level
transparent as that was the only way I could figure out making the
contours on the map transparent. I only want contours above 0.0 filled
and I want values equal to zero(which is most of the field) to be
transparent. I didn't like the way masking looked or even changing all
the 0's to a fill value as it looked pixelated rather than having smooth
contours.
This did what I wanted, but if there's a better way to do it.......
resQr@cnLevelSelectionMode = "ExplicitLevels"
resQr@cnLabelBarEndStyle = "ExcludeOuterBoxes"
resQr@cnLevels =
(/0.005,0.05,0.1,0.15,0.2,0.25,0.3,0.35,0.4,0.45,0.5,0.55,0.6,0.65,0.7,0.75,0.8/)
resQr@cnFillColors = ispan(11,215,12)
resQr@cnFillColors(0) = -1
Thanks, Tracy
On 2/28/2013 5:42 PM, Mary Haley wrote:
> On Feb 28, 2013, at 4:32 PM, Tracy Emerson wrote:
>
>> Hi all,
>>
>> #1. I am trying to figure out if there is a function in NCL that calculates the column integrated total cloud mixing ratio (mm) , from cloud water/ice mixing ratios (g/kg). I didn't find anything in my searches so I expect not.
>> I am trying to reproduce a figure that was made using RIP (which I've never used) which calculates this field (intcld).
> Hi Tracy,
>
> The only "mixing ratio" type of functions we have are "mixhum_ptrh" and "mixhum_ptd":
>
> http://www.ncl.ucar.edu/Document/Functions/Built-in/mixhum_ptrh.shtml
> http://www.ncl.ucar.edu/Document/Functions/Built-in/mixhum_ptd.shtml
>
> If you (or anybody else) have the Fortran code for the functions you're talking about, we can help you call them from NCL and/or we can eventually add them to NCL.
>
>
>> #2. The colorbar on the plot I made put the 1st color that was specified as the last color. i.e. the blue color should be 1st not last on the contour plot. I've attached my current code and figure.
> It looks to me like the colorbar is correct. You specified your colors to be:
>
> resQr@cnFillColors = ispan(17,215,11)
>
> and then you set the first two colors to transparent, which effectively makes the first two colors of your labelbar white:
>
> resQr@cnFillColors(0:1) = -1
>
> The third color in the labelbar, then, is that light bluish color, which corresponds to color index 39.
>
> The reason you see that dark blue at the end is because you specified 18 contours levels and 18 color fills.
> By default, you need to provide one more color than you have levels, because the levels represent values
> *between* colors. When NCL runs out of colors, it goes back to the beginning of your list, so somehow it
> picked up color index 17 (and not the -1 color like I would have expected).
>
> Anyway, what exactly do you want to see on your labelbar? If you really want those first two colors to be transparent,
> but you don't want to see any color boxes for them, then you should not include these two levels in your list
> of cnLevels. See example "lb_10.ncl" at:
>
> http://www.ncl.ucar.edu/Applications/labelbar.shtml
>
> This might be what you want? You can also look at example lb_12.ncl on that same page.
>
> --Mary
>
>> Thanks, Tracy
>> <6Aug_wrf_d1.png><plot_wrf_cross_sec_d1.ncl>_______________________________________________
>> ncl-talk mailing list
>> List instructions, subscriber options, unsubscribe:
>> http://mailman.ucar.edu/mailman/listinfo/ncl-talk
_______________________________________________
ncl-talk mailing list
List instructions, subscriber options, unsubscribe:
http://mailman.ucar.edu/mailman/listinfo/ncl-talk