Date: Mon Mar 18 2013 - 09:32:51 MDT
Hi NCLers,
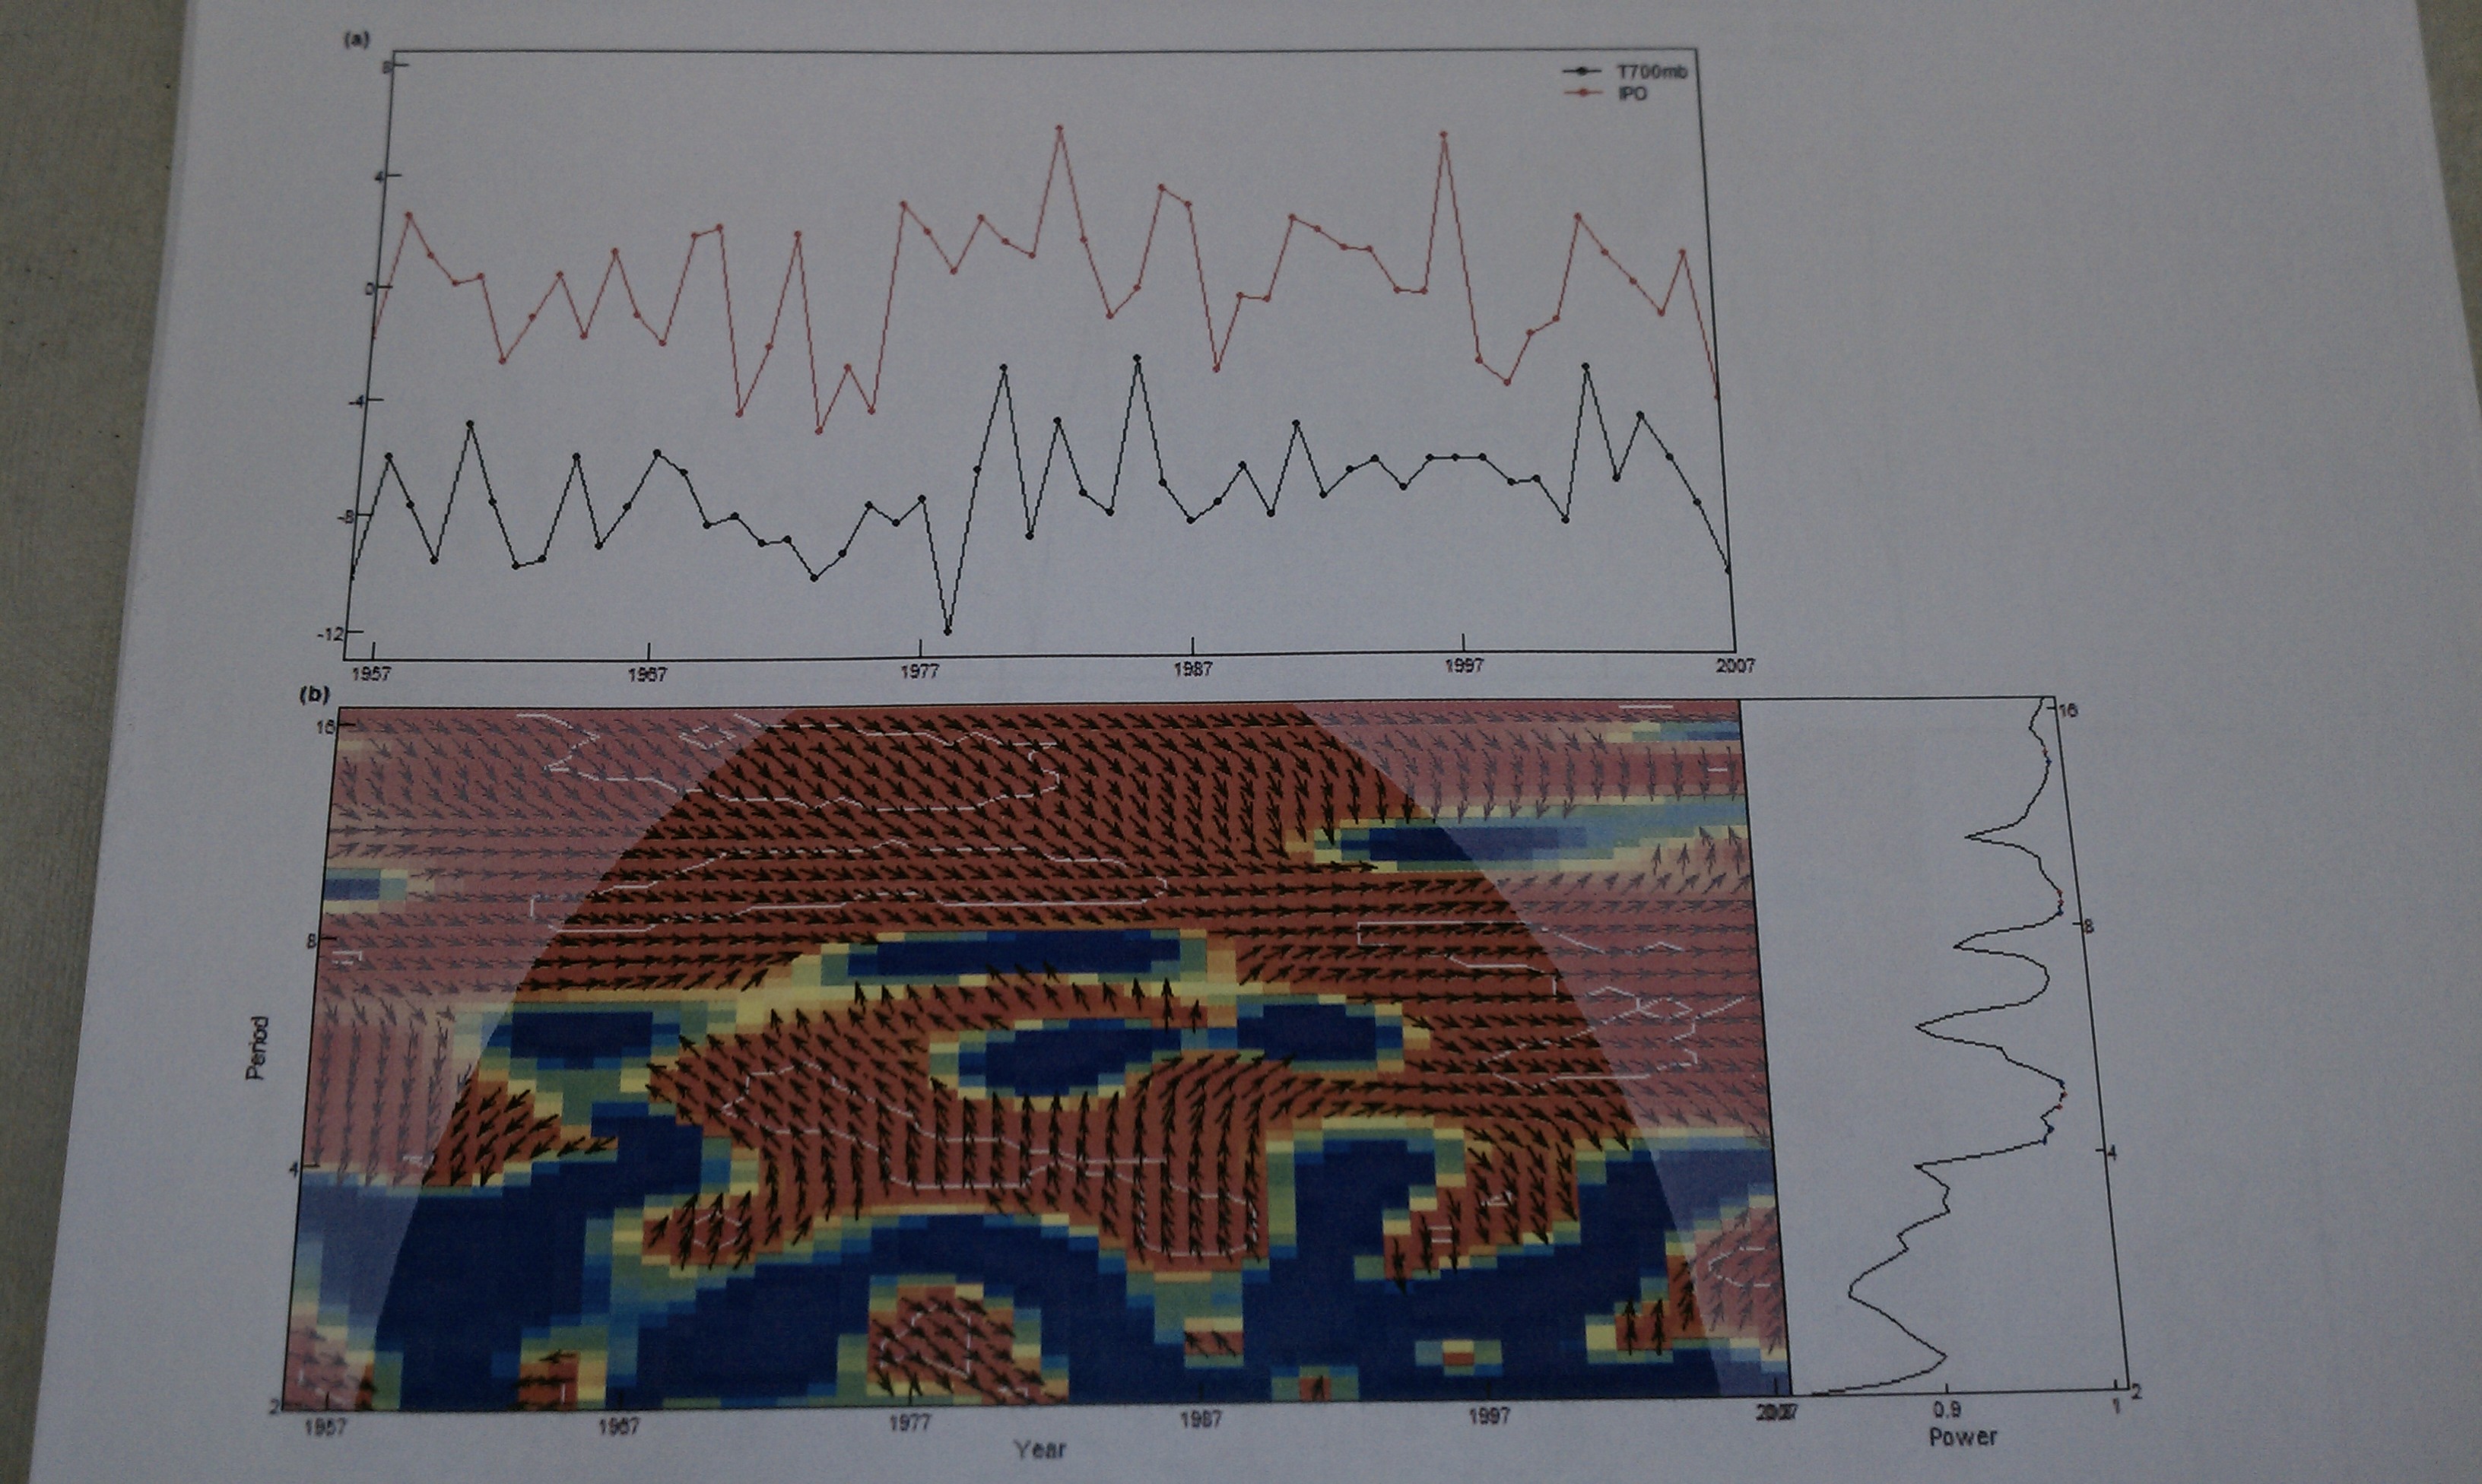
I have been making use of the wavelet function, and really like what it
does. Recently, my advisor showed me a figure made with R, I think. It
does analysis of two time series simultaneously and shows the spectral
coherence of the data. I am including a picture of the figure, I didn't
have access to the file itself otherwise I would have sent it along. The
arrows superimposed on the spectral plot show the phase relationship
between the time series, and the color contours show the strength of the
coherence of the signals. Is such a thing possible using NCL?
--
Danny Barandiaran
Department of Plants, Soils, and Climate
Utah State University
_______________________________________________
ncl-talk mailing list
List instructions, subscriber options, unsubscribe:
http://mailman.ucar.edu/mailman/listinfo/ncl-talk