Date: Mon Apr 29 2013 - 15:57:29 MDT
Thanks for including your script.
I'm not sure what you are trying to do with this line:
> plot = gsn_csm_xy (wks,transpose((/floatnames,floatnames/)), \
> transpose((/AB,AB/)),res)
>
The "floatnames" variable is a string, which you cannot pass to gsn_csm_xy for plotting.
The "transpose" function is supposed to be used for transposing a 2D array. For example, converting a 5 x 10 array to be a 10 x 5 array.
AB is a 1D array, so using transpose((/AB,AB/)) will give you an error.
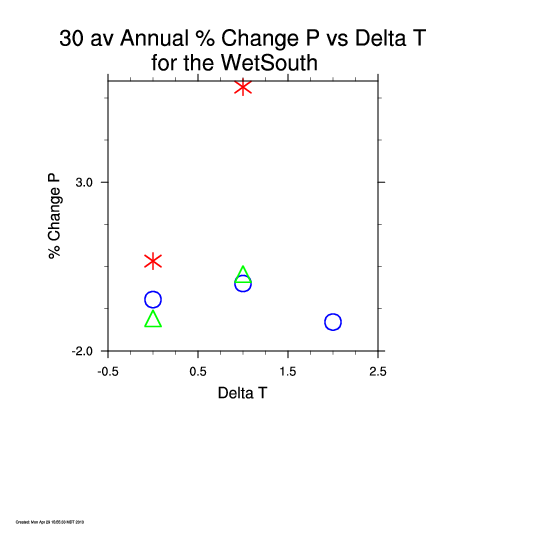
I see that you are trying to create a scatter plot, but it's not clear to me which points you want to be different colors.
For example, you have 7 points in your AB array, but then 9 indexes in your "xyMarkers" array, and only 3 colors in your "colors" array.
If you want each grouping of markers to have a different color and marker style, then you must turn AB into an n x m array, where "n" represents the different groups of markers you want, and "m" represents the most markers you have in any group. If any group doesn't have "m" values, then the rest of the "m" values have to be filled in with missing values.
I don't know what your X axis values are supposed to be, so I used "gsn_csm_y", which just uses index values for the X axis.
See the attached "nand.ncl" script. I arbitrarily took your "AB" array and turned it into a 3 x 3 array, so I could use three different marker styles and colors on it.
--Mary
> Am trying to plot the the graph of Argo Floats versus temp difference but the codes I wrote is generating some errors at the moment. Can some please guide me with this? The coding is given below:
>
> load "$NCARG_ROOT/lib/ncarg/nclscripts/csm/gsn_code.ncl"
> load "$NCARG_ROOT/lib/ncarg/nclscripts/csm/gsn_csm.ncl"
> load "$NCARG_ROOT/lib/ncarg/nclscripts/csm/contributed.ncl"
> load "$NCARG_ROOT/lib/ncarg/nclscripts/csm/shea_util.ncl"
>
> begin
> ;----------------------------------------------------------------------
> ; Data is hard-coded here. It was originally calculated by running
> ; a compute-intensive script.
> ;----------------------------------------------------------------------
> floatnames = (/"A","B","C","D","E","F","G"/)
> AB = (/-0.477,0,-1.142,-1.032,0.278,0.664,5.819/)
> ;B2B1 = (/0,0,-0.482,0,-0.257,0.107,0/)
> ;A2A1 = (/0.217,0,-0.66,0.813,0,0.537,-6.024/)
> ;----------------------------------------------------------------------
> ; Open a PS file and define the color table
> ;----------------------------------------------------------------------
>
> colors = (/"blue","green","red"/)
>
> wks = gsn_open_wks ("ps","scatter")
> gsn_define_colormap(wks,colors)
>
> ;----------------------------------------------------------------------
> ; Set some plot resources
> ;----------------------------------------------------------------------
> res = True
>
> res@gsnDraw = False ; Don't draw plot
> res@gsnFrame = False ; Don't advance frame
>
> ;
> ; Don't use gsnMaximize. Instead, we will control
> ; exactly where plot goes.
> ;
> res@vpXF = 0.2
> res@vpYF = 0.85
> res@vpWidthF = 0.5
> res@vpHeightF = 0.5
>
> ;---Some calculations to get min/max for Y axis.
> miny = min(AB)
> maxy = max(AB)
> ;minx = min(floatnames)
> ;maxx = max(floatnames)
>
> amaxy = maxy - abs(miny)
> amaxy = amaxy / 2.
> amaxy = amaxy + 25.
>
> aminy = maxy - abs(miny)
> aminy = aminy / 2.
> aminy = aminy - 25.
>
> ;---Resources for X/Y axes.
> res@trYMinF = aminy ; min value on y-axis
> res@trYMaxF = amaxy ; max value on y-axis
> ;res@trXMinF = 0. ; min value on x-axis
> ;res@trXMaxF = 5. ; max value on x-axis
>
> ;---XY marker resources
> res@xyMarkLineMode = "Markers"
> res@xyMarkerSizeF = 0.03
> res@xyMarkerThicknessF = 3.
> res@xyMonoMarkerColor = False ; Allow different colors for markers
> res@xyMarkerColors = colors(2:) ; It's okay to list more than
> ; you need here
> res@xyMarkers = (/4,4,4,7,7,7,3,6,6/)
>
> ;---Tickmark resources
> res@tmXBMode = "Manual"
> res@tmYLMode = "Manual"
> res@tmXBTickSpacingF = 1.
> res@tmYLTickSpacingF = 5.
>
> ;---Title resources
> res@tiMainString = "30 av Annual % Change P vs Delta T~C~" + \
> " for the WetSouth"
> res@tiXAxisString = "Delta T"
> res@tiYAxisString = "% Change P"
> res@tiMainFontHeightF = 0.03
>
> ;----------------------------------------------------------------------
> ; Create the scatter plot, but don't draw it yet.
> ;----------------------------------------------------------------------
> plot = gsn_csm_xy (wks,transpose((/floatnames,floatnames/)), \
> transpose((/AB,AB/)),res)
>
> ;----------------------------------------------------------------------
> ; Draw time stamp first, then the plot.
> ;----------------------------------------------------------------------
> infoTimeStamp(wks,0.005,"")
> draw(plot)
> frame(wks) ; Now advance the frame.
> end
>
> Sachin Ravilesh Nand | Software Engineer (Consultant)
> B.C.A (Bangalore University-India)
> European Union Global Climate Change Alliance Project.
> Pacific Centre for Environment and Sustainable Development.
> University of the South Pacific.
> E: sachin.nand@usp.ac.fj
> T: (+679) 32 32205
>
> _______________________________________________
> ncl-talk mailing list
> List instructions, subscriber options, unsubscribe:
> http://mailman.ucar.edu/mailman/listinfo/ncl-talk
_______________________________________________
ncl-talk mailing list
List instructions, subscriber options, unsubscribe:
http://mailman.ucar.edu/mailman/listinfo/ncl-talk
- application/octet-stream attachment: nand.ncl