Date: Tue May 07 2013 - 03:02:38 MDT
Hello Recipient,
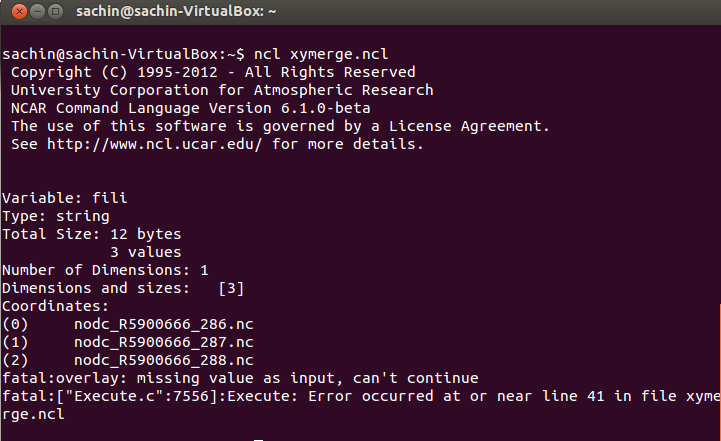
After many trials of merging the profile into one XY plot, I failed. Can anyone please help me out and find out for me what has happened to this code and what are the changes needed in order to make it compile successfully. The code is given below and the image for the error its generating is also given below:
Please find the three ".nc" files attached in this mail, which are the profiles of one float named as "R5900666" and I want to merge the graph projected by each profile into one XY plot. Can anybody asiist me as soon as possible?
load "$NCARG_ROOT/lib/ncarg/nclscripts/csm/gsn_code.ncl"
load "$NCARG_ROOT/lib/ncarg/nclscripts/csm/gsn_csm.ncl"
load "$NCARG_ROOT/lib/ncarg/nclscripts/csm/contributed.ncl"
;************************************************
begin
;************************************************
; get list of files
;************************************************
diri = "pacific-12-2012/pacific/2012/12/" ; input directory
fili = systemfunc("cd "+diri+" ; ls nodc_R5900666_*.nc")
print(fili)
nfili = dimsizes(fili)
;************************************************
; plot resources
;************************************************
res = True ; plot mods desired
res@trYReverse = True ; reverse Y-axis
res@xyLineThicknessF = 2 ; choose dash patterns
res@gsnDraw = False
res@gsnFrame = False
resP = True
resP@gsnMaximize = True
plot1 = new(nfili,"graphic")
plot2 = new(nfili, "graphic")
;************************************************
; read in data: there is only 1 time, 1 lat, 1 lon
;************************************************
do nf=0,nfili-1
f = addfile (diri+fili(nf),"r")
t = f->temperature(0,:,0,0)
s = f->salinity(0,:,0,0)
if (nf.ne.0) then
overlay(plot1(0),plot1(nf))
overlay(plot1(0),plot2(nf)) .......................................Error generated in here as given in the image below
end if
sfx = get_file_suffix(fili(nf),0)
pname = sfx@fBase
wks = gsn_open_wks ("ps",pname)
res@xyLineColor = (/"blue"/)
plot1(nf) = gsn_csm_xy (wks,t,t&pressure,res) ; create plot
res@xyLineColor = (/"red"/)
plot2(nf) = gsn_csm_xy (wks,s,s&pressure,res) ; create plot
delete([/t,s/])
end do
resP@txString = fili(nf)
gsn_panel(wks,(/plot1(0),plot2(0)/),(/2,1/),resP)
end
The Error image is given below:
[cid:image001.png@01CE4B64.D538DF10]
Thanks and best regards.
Sachin Ravilesh Nand | Software Engineer (Consultant)
B.C.A (Bangalore University-India)
European Union Global Climate Change Alliance Project.
Pacific Centre for Environment and Sustainable Development.
University of the South Pacific.
E: sachin.nand@usp.ac.fj<mailto:sachin.nand@usp.ac.fj>
T: (+679) 32 32205
_______________________________________________
ncl-talk mailing list
List instructions, subscriber options, unsubscribe:
http://mailman.ucar.edu/mailman/listinfo/ncl-talk
- application/octet-stream attachment: nodc_R5900666_286.nc
- application/octet-stream attachment: nodc_R5900666_287.nc
- application/octet-stream attachment: nodc_R5900666_288.nc