Date: Thu May 23 2013 - 02:19:26 MDT
Dear Mary,
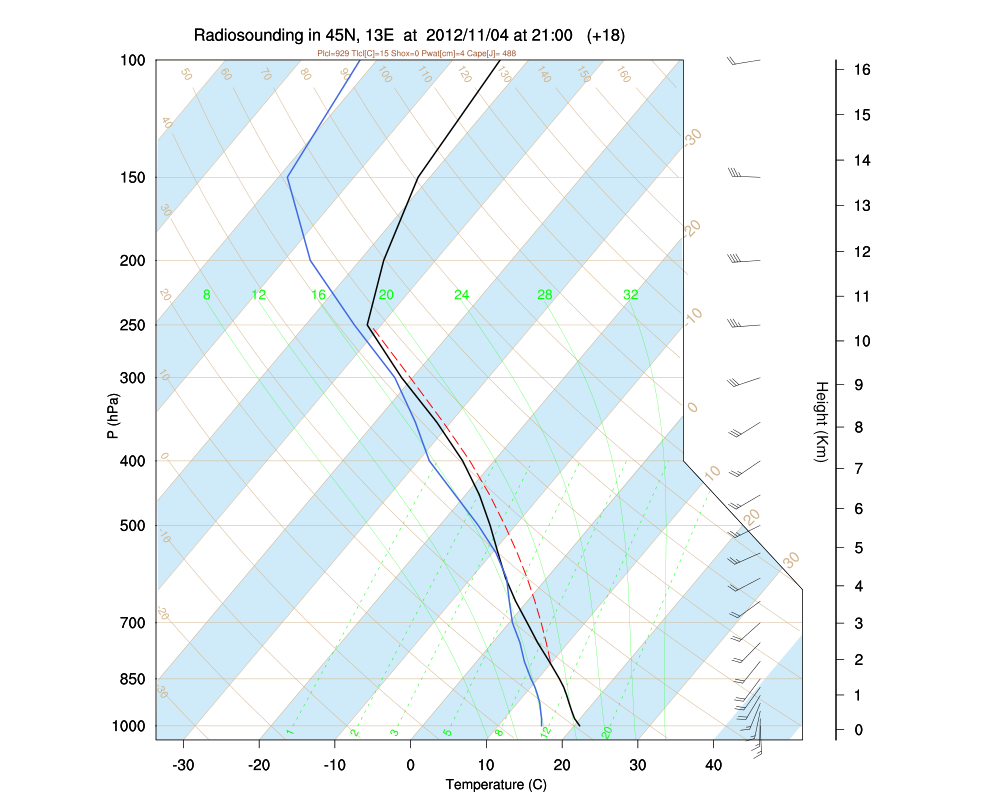
as you may see from the attached profile, I believe there is a problem in
the computation of the Level of Free Convection (LFC). The red dashed line
seems to be not correctly drawn.
If you start from the bottom, following the dry adiabat and the
isohygrometric up to the LCL and then following the saturated adiabat, you
should reach the LFC not at 850 hpa (as in the plot) but at slightly
higher level (less than 850 hPa).
I was wondering how the red line is drawn.
May you help me please?
Thanks
Best regards
Silvio
**********************************************
* Silvio Davolio *
* *
* ISAC - CNR *
* Via Gobetti, 101 *
* 40129 Bologna *
* ITALY *
* *
* Ph +39 051 6399620 *
* Fax +39 051 6399658 *
* Mailto: S.Davolio AT isac.cnr.it *
* s.davolio AT libero.it (home) *
**********************************************
Web Page: http://www.isac.cnr.it/dinamica/davolio
Cloud Gallery: http://www.isac.cnr.it/dinamica/davolio/NUBI
--- ---
Sulla terra c'è abbastanza per soddisfare i bisogni di tutti,
ma non per soddisfare l'ingordigia di pochi. (Gandhi)
Earth provides enough to satisfy every man's need,
but not every man's greed. (Gandhi)
--- ---
_______________________________________________
ncl-talk mailing list
List instructions, subscriber options, unsubscribe:
http://mailman.ucar.edu/mailman/listinfo/ncl-talk