Date: Mon Jun 03 2013 - 07:29:02 MDT
Dear All,
I have got RCM data from Cordex with the following attributes
5 Variables : lat, lon, tasmin, time, height
file global attributes:
Conventions : CF-1.4
contact : sms416@kongju.ac.kr
creation_date : '2012-09-15 T02:44:17Z'
experiment_id : historical
experiment : Projection run with RCP historical
driving_experiment : HadGEM2-AO, projection, r1i1p1
driving_model_id : HadGEM2-AO
driving_model_ensemble_member : r1i1p1
driving_experiment_name : projection
frequency : day
institution_id : KNU
institution : Kongju National University, Gongju, South Korea
model_id : RegCM4
model : Regional Climate Model, ICTP
RCM_version_id : v4
RCM_version : version 4.0
project_id : CORDEX
dimensions:
ncl_scalar = 1
south_north = 195
west_east = 241
time = 1800 // unlimited
variables:
double lat ( south_north, west_east )
units : degrees_north
long_name : latitude coordinate
standard_name : latitude
description : Latitude, South is negative
double lon ( south_north, west_east )
units : degrees_east
long_name : longitude coordinate
standard_name : longitude
description : Longitude, West is negative
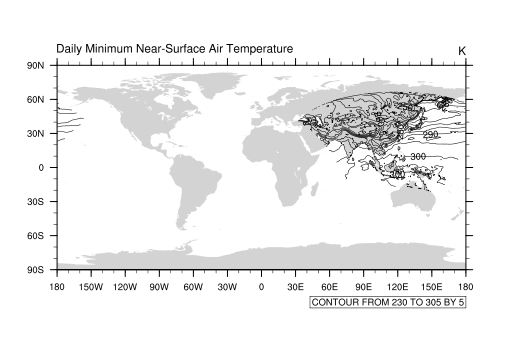
*I have used ncl to plot that RCM on the native grid*
ncl 0> f=addfile("1996_2001.nc","r")
ncl 1> temp=f->tasmin
ncl 2> newtemp=temp(0,:,:)
ncl 3> load "$NCARG_ROOT/lib/ncarg/nclscripts/csm/gsn_code.ncl"
ncl 4> load "$NCARG_ROOT/lib/ncarg/nclscripts/csm/gsn_csm.ncl"
ncl 5> lat=f->lat
ncl 6> lon=f->lon
ncl 7> newtemp@lat2d=lat
ncl 8> newtemp@lon2d=lon
ncl 9> wks=gsn_open_wks("x11","res")
ncl 10> plot=gsn_csm_contour_map(wks,newtemp,False)
I have attached that plot herewith.
*Now my problem is , I need to extract data only for study area. My study
area ranges from 27°09’03” N to 28°06’24” N and 86°26’02”E to 86°2’52” E.
This RCM data has a resolution of 5KM. How I can identify those grids only
covering my study area and extract data for only those grids for the whole
period. Please help me in this matter.*
* *
_______________________________________________
ncl-talk mailing list
List instructions, subscriber options, unsubscribe:
http://mailman.ucar.edu/mailman/listinfo/ncl-talk
- application/pdf attachment: myproblem.pdf