Date: Fri Jul 12 2013 - 10:36:59 MDT
Hi Igor,
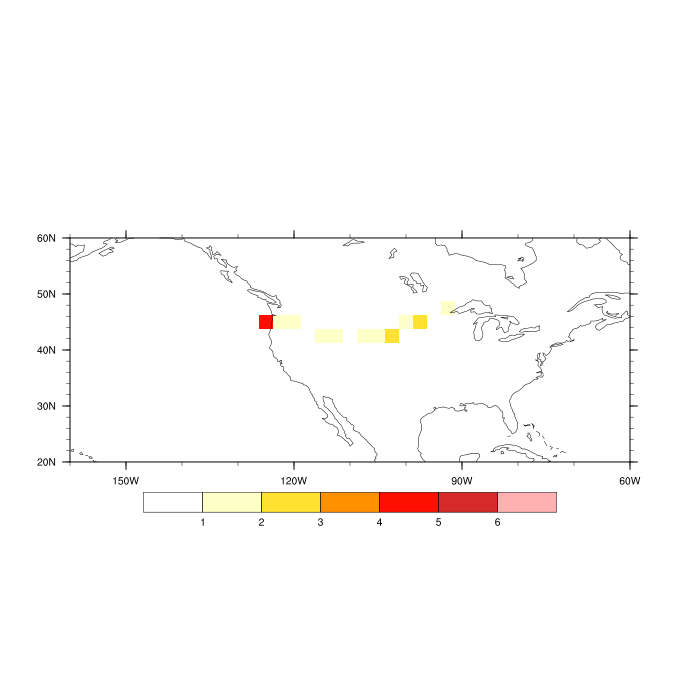
I think the best thing to do would be to set up an array that contains
the same coordinates that are present in your ascii file, and then use
coordinate subscripting and a do loop to count the number of times the
storm goes over a particular grid box. That way you end up with an array
that can be easily plotted. I have attached a script that does this,
along with a resulting plot.
A few things to note:
1) Test out what I have created, including print and printVarSummary
statements and such, to make sure the script is doing what you think it
is doing and what it is supposed to be doing.
2) I set up the master array as follows:
arr = new((/73,144/),integer,-999)
arr!0 = "lat"
arr&lat = fspan(-90,90,73)
arr&lat@units = "degrees_north"
arr!1 = "lon"
arr&lon = fspan(0,357.5,144)
arr&lon@units = "degrees_east"
Your ascii file has storm locations on a 2.5 x 2.5 grid, so I set up the
arr array to match. You don't necessarily need to match things up as I
did. For instance you can set arr to be on a 1 degree grid, and the
coordinate subscripting will place the storm location at the nearest
coordinates. This is a judgement call that you will have to make.
3) The longitudes of arr run from 0:360, again matching your ascii data.
If a different ascii file contains longitudes that run from -180:180,
you will have to modify the script to account for this.
If you have any further questions please respond to the ncl-talk email
list.
Good luck,
Adam
On 07/10/2013 04:21 PM, igor akkerman wrote:
> Hi all,
>
> I need to calculate the density of storms based on the data from the
> ascii file.
> One line in the ascii file means one storm with its latitude and
> longitude. In order to get the storm density, I think the first step
> is to save lon and lat of the first storm, then go to the next storm,
> etc. The next step would be taking a particular grid point and sum all
> the storms that passed through it. Looping though all the grid points
> I think I will get the density [number of storms] units. I got myself
> confused with setting the counters to get the density. Could you
> please help me with this?
>
> The ascii file:
>
> lon lat SLP
> 3.75 19 267.50 47.50 998.40
> 4.00 19 262.50 45.00 996.50
> 4.25 19 262.50 45.00 994.80
> 4.50 19 260.00 45.00 994.20
> 4.75 19 257.50 42.50 993.90
> 5.00 19 257.50 42.50 994.30
> 5.25 19 255.00 42.50 993.60
> 5.50 19 252.50 42.50 995.40
> 5.75 19 247.50 42.50 996.00
> 6.00 19 245.00 42.50 997.50
> 6.25 19 240.00 45.00 1000.00
> 6.50 19 235.00 45.00 999.90
> 6.75 19 235.00 45.00 1000.20
> 7.00 19 235.00 45.00 1001.50
> 7.25 19 235.00 45.00 1004.30
> 7.50 19 237.50 45.00 1006.30
> 3.75 20 157.50 50.00 998.00
> 4.00 20 152.50 47.50 1002.90
> 4.25 20 155.00 47.50 1003.70
> 4.50 20 155.00 47.50 1006.30
> 4.75 20 155.00 47.50 1007.70
> 3.75 21 147.50 62.50 994.60
> 4.00 21 145.00 60.00 996.50
>
> stn_data = readAsciiTable("out_"+i+".txt",5,"float",0)
> stn_data@_FillValue = -999.0
> storm_number = stn_data(:,1)
> lon = stn_data(:,2)
> lat = stn_data(:,3)
> slp = stn_data(:,4)
>
> n=0
> lat1=lat(n)
> lon1=lon(n)
> storm(n)=n
> n=n+1
>
> m=0
> if (lat1(m)=lat2.and.lon1(m)=lon2) then
> ...
>
>
>
> _______________________________________________
> ncl-talk mailing list
> List instructions, subscriber options, unsubscribe:
> http://mailman.ucar.edu/mailman/listinfo/ncl-talk
--
______________________________________________________________
Adam Phillips                                asphilli@ucar.edu
NCAR/Climate and Global Dynamics Division       (303) 497-1726
P.O. Box 3000
Boulder, CO 80307-3000    http://www.cgd.ucar.edu/cas/asphilli
_______________________________________________
ncl-talk mailing list
List instructions, subscriber options, unsubscribe:
http://mailman.ucar.edu/mailman/listinfo/ncl-talk