Date: Tue Jul 16 2013 - 21:00:44 MDT
Hi All,
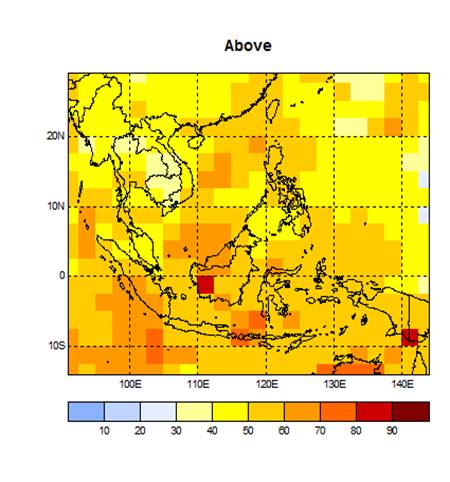
I am trying to provide spatial plots for probabilistic forecasts in 3
categories using gridded values.
I was wondering if there are any (scalar) plots that would preserve the
"griddedness" of the data without smoothing them such as the one attached.
Thanks,
Raizan
[image: http://www.weather.gov.sg/wip/image/image_gallery?img_id=1922]****
** **
* *
** **
** **
_______________________________________________
ncl-talk mailing list
List instructions, subscriber options, unsubscribe:
http://mailman.ucar.edu/mailman/listinfo/ncl-talk