Date: Thu Jul 25 2013 - 10:15:24 MDT
Xi,
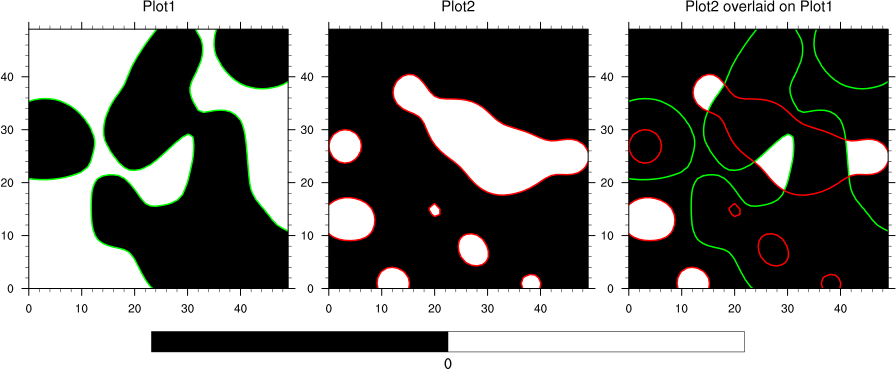
See the attached example and image. Is this what you need? I draw the contour lines in different colors so you could see them in the final overlay plot.
What I did was to set cnFillColors for both plots, using RGBA quadruplets. This allows me to set the transparency levels for each color.
For the first plot, I made both contour fill colors (black and white) fully opaque (non-transparent).
For the second plot, I made black fully opaque, and white fully transparent.This way, when you overlay, you will only see white if both contour areas are white in the same locations.
--Mary
On Jul 24, 2013, at 3:24 AM, Xi Chang wrote:
>
> Hallo NCL,
>
> I have a question, how can i possibly create such an overlay contour from two different fields, let's say:
>
> X (contour: negative value= black, positive value= white)
> Y (contour: negative value= black, positive value= white)
>
> then do an "OVERLAY X slice Y". The result of overlay product from two contour map will be:
>
> if negative values + negative values == Black
> if positive + negative == Black
> if negative + positive == Black
> if positive + positive === "WHITE"
>
> X slice Y.
>
> I really appreciate for your hints.
>
> Xi
> _______________________________________________
> ncl-talk mailing list
> List instructions, subscriber options, unsubscribe:
> http://mailman.ucar.edu/mailman/listinfo/ncl-talk
_______________________________________________
ncl-talk mailing list
List instructions, subscriber options, unsubscribe:
http://mailman.ucar.edu/mailman/listinfo/ncl-talk
- application/octet-stream attachment: newcolor_17.ncl