Date: Fri Aug 02 2013 - 11:42:55 MDT
Hi Jinqiang,
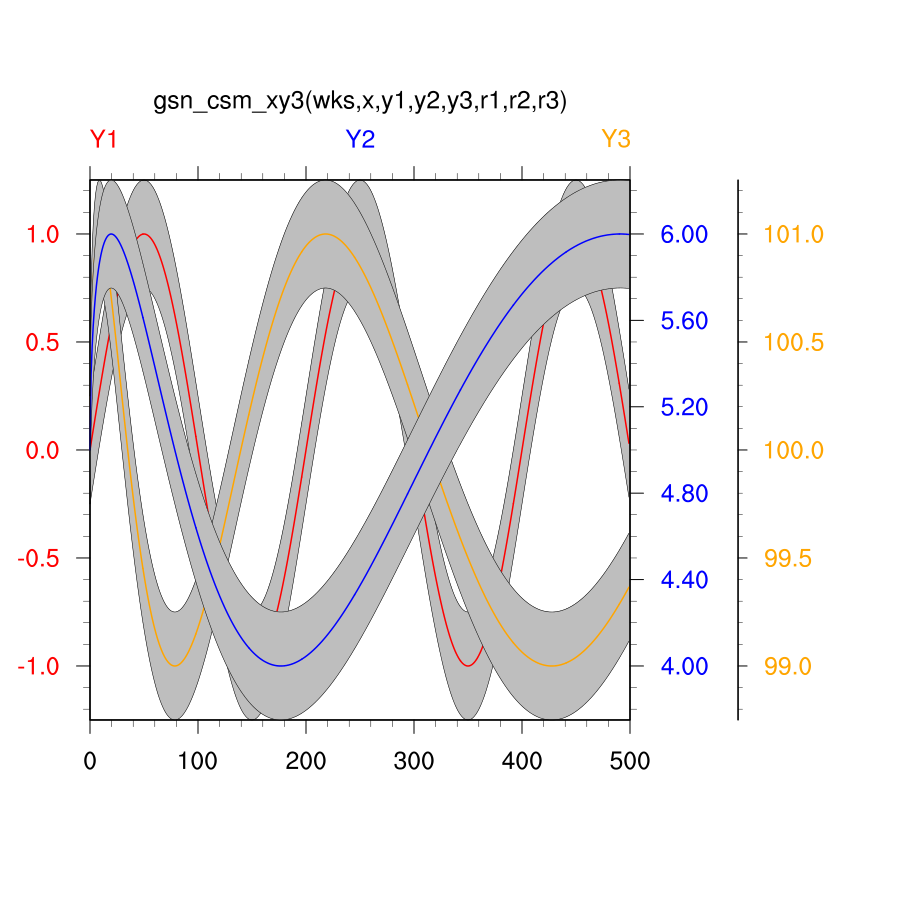
The code is a little complicated to debug without being able to actually run it. I created an example that seems to work for me, although I do get a warning:
(0) fill_bw_xy: Error: If filling between two curves, one set must be 2D, and the other 1D.
Can you try running the attached and let me know if it works for you?
The weird thing that I don't quite understand is that the Y2 curve is appearing on top, even though the Y3 curve was added last. Is this the issue you are talking about?
--Mary
On Jul 31, 2013, at 3:59 PM, Jinqiang Chen wrote:
> Dear all,
>
> I have a problem with gsn_csm_xy3 when plotting three curves with their uncertainties. The error and part of my codes are as follows. I am also attaching the figure for reference.
>
> note: 1) the variables : global, co2, aer are 1D mean value, those with suffix _ext or _sigma are 2D, with the upper bound and lower bound of the 1D mean value.
> 2) The purpose of my figure is to draw three curves with their uncertainties, but the figure I plotted gave me just three curves with uncertainties of two of them.
> 3) I tried to switch the order of co2 and aer as well as those with suffix, it seems that only for the first two 2D parameters in the gsn_csm_xy3 filling can be done between the upper and lower bounds, leaving the third 2D vectors unfilled.
>
> Thank you very much!
>
> Jinqiang Chen
>
> ------------------------------beginning of error---------------------------------------
> (0) fill_bw_xy: Error: If filling between two curves, one set must be 2D, and the other 1D.
> (0) fill_bw_xy: Error: If filling between two curves, one set must be 2D, and the other 1D.
> warning:TransformPreDraw: tfPolyDrawList element 0 is invalid
> warning:TransformPreDraw: tfPolyDrawList element 0 is invalid
> --------------------------------endding of error----------------------------------------
>
>
> -------------------------------beginning of code--------------------------------------
> res = True ; plot mods desired
> res@gsnDraw = False ; don't draw yet
> res@gsnFrame = False ; don't advance frame yet
>
> res@vpHeightF = 0.4 ; change aspect ratio of plot
> res@vpWidthF = 0.6
>
> res@trYMaxF = 3.5
> res@trYMinF = -1.5
> res@trXMinF = 1860 ; set x-axis minimum
> res@trXMaxF = 2100
>
> res@xyMonoLineColor = False ; want colored lines
> res@xyLineColors = (/"Blue"/) ; colors chosen
> res@xyLineThicknesses = (/4./) ; line thicknesses
> res@xyDashPatterns = (/0./) ; make all lines solid
>
> res@tiYAxisString = "~F35~J~F~C" ; add an axis title
> res@txFontHeightF = 0.0195 ; change title font heights
>
> resL = True
> resL@gsnDraw = False ; don't draw yet
> resL@gsnFrame = False ; don't advance frame yet
> resL@trYMaxF = 6.5
> resL@trYMinF = 0.0
> resL@xyMonoLineColor = False ; want colored lines
> resL@xyLineColors = (/"red"/) ; colors chosen
> resL@xyLineThicknesses = (/4./) ; line thicknesses
> resL@xyDashPatterns = (/0./) ; make all lines solid
>
> resR = True
> resR@gsnDraw = False ; don't draw yet
> resR@gsnFrame = False ; don't advance frame yet
> resR@trYMaxF = 3.5
> resR@trYMinF = 0.
> resR@xyMonoLineColor = False ; want colored lines
> resR@xyLineColors = (/"yellow"/) ; colors chosen
> resR@xyLineThicknesses = (/4./) ; line thicknesses
> resR@xyDashPatterns = (/0./) ; make all lines solid
> resL@amOrthogonalPosF = 0.62
> top_plot = gsn_csm_xy3 (wks,time,global, co2, aer, res, resR, resL) ; create line plot
>
> ; Create a plot with the area between both curves filled in blue.
> delete(res@xyLineColors)
> res@gsnXYFillColors = "lightskyblue1"
> res@xyLineColor = -1 ; We don't want the line, so make it transparent.
> delete(resL@xyLineColors)
> resL@gsnXYFillColors = "lightskyblue1"
> resL@xyLineColor = -1 ; We don't want the line, so make it transparent.
> delete(resR@xyLineColors)
> resR@gsnXYFillColors = "lightskyblue1"
> resR@xyLineColor = -1 ; We don't want the line, so make it transparent.
> mid_plot = gsn_csm_xy3 (wks,time,global_sigma, co2_sigma, aer_sigma, res, resR, resL) ; Create filled XY plot.
> ; Create a plot with the area between both curves filled in pink.
> res@gsnXYFillColors = "azure3"
> res@xyLineColor = -1 ; We don't want the line, so make it transparent.
> resL@gsnXYFillColors = "azure3"
> resL@xyLineColor = -1 ; We don't want the line, so make it transparent.
> resR@gsnXYFillColors = "azure3"
> resR@xyLineColor = -1 ; We don't want the line, so make it transparent.
> bot_plot = gsn_csm_xy3 (wks,time,global_ext,co2_ext,aer_ext, res, resR, resL) ;
> overlay(bot_plot,mid_plot)
> overlay(bot_plot,top_plot)
> -----------------------------------------endding of code-------------------------------------------
>
> --------------------
> Jinqiang Chen
> Environmental Science and Engineering
> California Institute of Technology
> 1200 E. California Blvd.
> mc: 131-24
> Pasadena, CA 91125
> Tel: +1 (626) 395-8704
> Fax: +1 (626) 395-8535
> email: jcchen@caltech.edu
> jcchen@gps.caltech.edu
> http://www.gps.caltech.edu/~jcchen/
>
>
> <global_tas.pdf>_______________________________________________
> ncl-talk mailing list
> List instructions, subscriber options, unsubscribe:
> http://mailman.ucar.edu/mailman/listinfo/ncl-talk
_______________________________________________
ncl-talk mailing list
List instructions, subscriber options, unsubscribe:
http://mailman.ucar.edu/mailman/listinfo/ncl-talk
- application/octet-stream attachment: fill_gsn_csm_xy3.ncl