Date: Fri Dec 27 2013 - 11:19:17 MST
Hi,
I don't think you are getting just two colors. What's happening is that this function doesn't span the full color map, and hence it only returns the first N colors in your color map.
Since you are using a color map that doesn't change very much in the first 17 colors, it looks like they are all the same.
If you use a color map like "psgcap", you will see the difference.
In the 6.2.0 release of NCL, we have two new functions to replace GetFillColor and GetFillColorIndex, called "get_color_rgba" and "get_color_index". These functions *will* span the full color map.
The calling sequence is very similar:
; mkres@gsMarkerColor = GetFillColor(cnLevels,cmap,data(i))
mkres@gsMarkerColor = get_color_rgba(cmap,cnLevels,data(i))
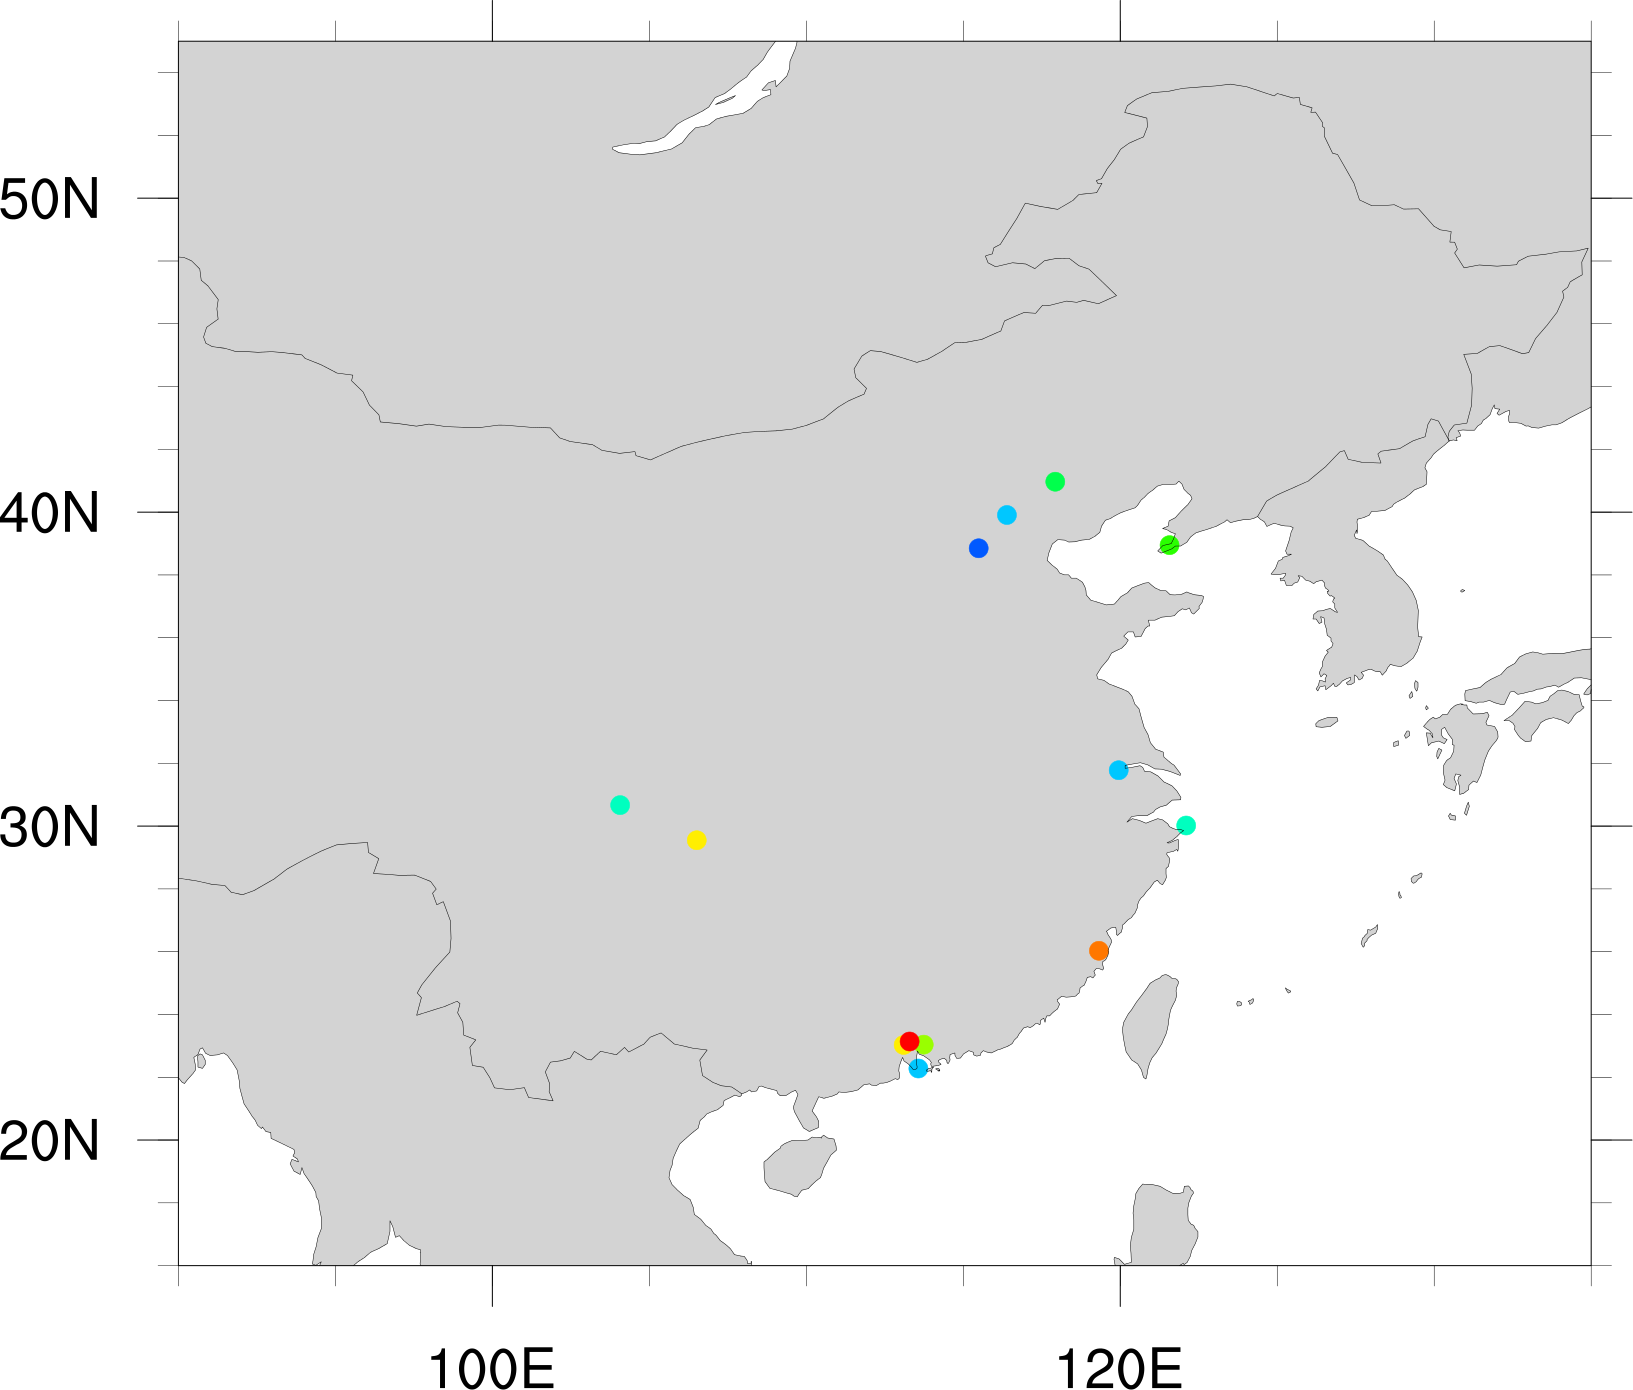
Please see the attached script, which shows your script using this new function, instead of GetFillColor. It still uses the rainbow color map. I've also attached "colorutils.ncl", which contains these new functions in case you want to use them now.
--Mary
On Dec 23, 2013, at 7:27 PM, zhangbinrc <zhangbinrc@163.com> wrote:
> Hi all,
>
> I am trying to plot some data for 13 cities. I use ¡°rainbow¡±color. Each marker represents one city. But only two colors occur (purple and red) in the figure. Does anybody have similar problem?
>
> the script is as following:
> ---------------------------------------------------------------------------------------------------
> load "$NCARG_ROOT/lib/ncarg/nclscripts/csm/gsn_code.ncl"
> load "$NCARG_ROOT/lib/ncarg/nclscripts/csm/gsn_csm.ncl"
> load "$NCARG_ROOT/lib/ncarg/nclscripts/wrf/WRF_contributed.ncl"
> load "$NCARG_ROOT/lib/ncarg/nclscripts/wrf/WRFUserARW.ncl"
>
> begin
>
> ; creating workstations to plot to different file
> off = "x11"
> ofn = "2013.1.pm25_spatial_cbmz_month"
> wks = gsn_open_wks(off,ofn)
> color = "rainbow"
> gsn_define_colormap(wks,color)
> cmap= gsn_retrieve_colormap(wks)
> cnLevels = (/10.0,20.0,30.0,40.0,50.0,60.0,70.0,80.0,90.0,100.0/)
>
> ip_lats = (/ 38.85, 31.78, 30.67, 40.97, 38.95, 23.04, 23.03, 26.03, 23.14,\
> 29.55, 30.02, 22.28, 39.91/)
>
> ip_lons= (/ 115.49, 119.95,104.07, 117.93, 121.57, 113.74, 113.10, 119.32, 113.29,\
> 106.51, 122.10, 113.57, 116.39/)
>
> res=True
> res@gsnMaximize = True ; enlarge plot
> res@gsnDraw = False ; Don't draw yet
> res@gsnFrame = False ; Don't advance frame yet
>
> res@mpDataBaseVersion = "Ncarg4_1"
> res@mpOutlineSpecifiers=(/"China:states","Taiwan"/)
> res@mpOutlineOn = True
> res@mpOutlineBoundarySets = "Geophysical" ;"AllBoundaries" "National"
> minlat = 16
> maxlat = 55
> minlon = 90
> maxlon = 135
> res@mpMinLatF = minlat
> res@mpMaxLatF = maxlat
> res@mpMinLonF = minlon
> res@mpMaxLonF = maxlon
>
> map = gsn_csm_map(wks,res); create plot
>
> dum = new(13,"graphic")
> mkres = True
> mkres@gsMarkerIndex = 1
> mkres@gsMarkerSizeF = 50. ; Increase marker sizes.
>
> data = (/ 20.0,30.0,40.4,50.5,60.5,70.5,80.5,90.5,100.5,80.3,45.1,35.1,34.5/)
> do i= 0, 12
> mkres@gsMarkerColor = GetFillColor(cnLevels,cmap,data(i))
> dum (i)= gsn_add_polymarker(wks,map,ip_lons(i),ip_lats(i),mkres)
> end do
>
> draw(map)
> frame(wks)
>
> end
>
> ------------------------------------------------------------------------------------------------------
>
> ÕÅ±ó ²©Ê¿Éú/Bin Zhang Ph.D. Candidate
> Ç廪´óѧµØÇòϵͳ¿ÆѧÑо¿ÖÐÐÄ/ Center for Earth System Science, Tsinghua
> Email:zhangbin06@mails.tsinghua.edu.cn
> _______________________________________________
> ncl-talk mailing list
> List instructions, subscriber options, unsubscribe:
> http://mailman.ucar.edu/mailman/listinfo/ncl-talk
_______________________________________________
ncl-talk mailing list
List instructions, subscriber options, unsubscribe:
http://mailman.ucar.edu/mailman/listinfo/ncl-talk
- application/octet-stream attachment: markers.ncl
- application/octet-stream attachment: colorutils.ncl