Date: Mon Jan 13 2014 - 09:52:36 MST
re: "compute the p-value that is associated
to each regression coefficient"
I was hoping someone else would answer this. I am not a statistician.
**Hopefully**, someone more knowledgeable than I can help here.
The p-values for the partial regression coefficients ('b') can
be calculated via:
t(m) = b(m)/stderr(b(m))
where 't(m)' is the t-value and 'stderr(b(m))' is the standard
error of the 'b'.
eg: from the R output below for X2: t=0.022573/0.008168=> 2.764
Unfortunately, I am not sure how to calculate stderr(b(m))
Again, perhaps someone could modify the attached NCL script.
================================================================
[1] If you have 'R' available, you could use the following approach.
If you have used NCL to do the 'heavy lifting' (ie pre-process
the data), create an ascii (or binary, or netCDF) file which can be
read by R. Here it is a sample ascii file.
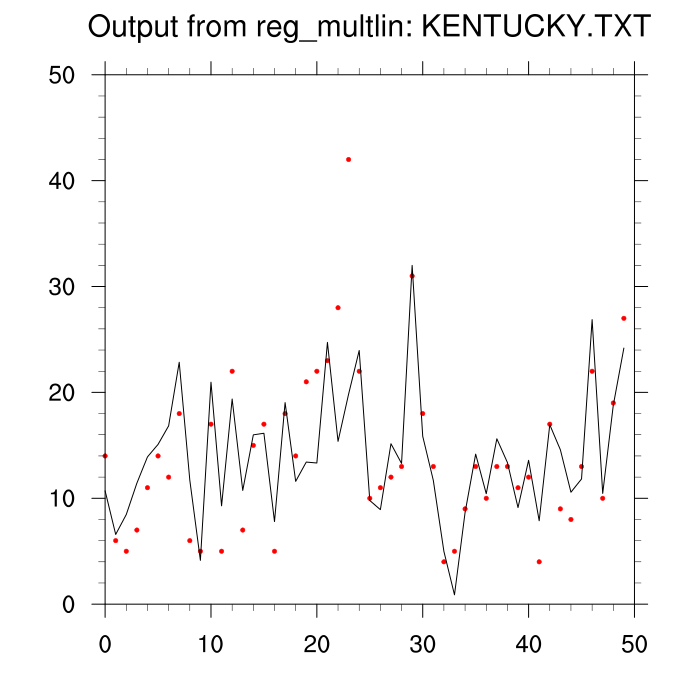
The sample data set [KENTUCKY.TXT] is the same as is used
in Example 3 at
http://www.ncl.ucar.edu/Document/Functions/Built-in/reg_multlin.shtml
Start R, then enter the following
df = read.table("KENTUCKY.TXT", header=TRUE) # ascii => data frame
df # print 'df'
mlr <- lm(Y~., data=df) # linear model
mlr # output results ... this contains the info you want
# see 'Coefficients' and significance
+++++++> output from R's 'mlr' function <++++++++++++
Call:
lm(formula = Y ~ ., data = df)
Coefficients:
(Intercept) X1 X2 X3 X4
X5
-2.244460 0.005091 0.022573 -0.232804 0.062611
-0.002038
X6
-0.116584
> summary(mlr)
Call:
lm(formula = Y ~ ., data = df)
Residuals:
Min 1Q Median 3Q Max
-5.7159 -2.8806 -0.7836 1.2759 22.1562
Coefficients:
Estimate Std. Error t value Pr(>|t|)
(Intercept) -2.244460 11.270778 -0.199 0.84309
X1 0.005091 0.010959 0.465 0.64458
X2 0.022573 0.008168 2.764 0.00838 **
X3 -0.232804 0.175949 -1.323 0.19278
X4 0.062611 0.020587 3.041 0.00400 **
X5 -0.002038 0.002186 -0.932 0.35656
X6 -0.116584 0.072610 -1.606 0.11568
---
Signif. codes: 0 �***� 0.001 �**� 0.01 �*� 0.05 �.� 0.1 � � 1
Residual standard error: 5.136 on 43 degrees of freedom
Multiple R-squared: 0.6136, Adjusted R-squared: 0.5596
F-statistic: 11.38 on 6 and 43 DF, p-value: 1.394e-07
==========================================================
[2] As noted, I don't know how to compute the standard error of
the coefficients which is necessary to compute the t-values.
Hopefully, someone more knowledgeable than I can help!!!!!
Attached is an NCL script (reg_multlin.ncl_talk.ncl)
with a local driver function that can be reused.
The script returns return the (overall) multiple regression
coef (r) and the F-statistic with dof=(M,N-M-1). You could
look up the p-value.
See the output: ncl_talk.reg_multlin (attached)
The NCL output matches the R output except for the se(b(m))
related quantities.
Good luck
On 1/8/14, 2:26 PM, Strada, Susanna wrote:
> Hi,
>
> I performed a multiple linear regression analysis using NCL function "reg_multlin" to obtain a 2D (lat,lon) map of standardized regression coefficients (6 independent variables, 30 observations).
>
> N = dimsizes(y)
> M = N_vars
> X = new( (/M+1,N/), "float" )
> X(0,:) = 1.0
> X(1,:) = x1
> X(2,:) = x2
> X(3,:) = x3
> X(4,:) = x4
> X(5,:) = x5
> X(6,:) = x6
> beta = reg_multlin(y, X, False)
>
> Now, I would like to compute the p-value that is associated to each regression coefficient.
> I'm thinking about, firstly, computing the t-value by doing the ratio between a regression coefficient and its standard deviation, afterwards I will use the NCL function "betainc" to get the p-value for a Student t-test.
>
> My problem is that I don't know how to obtain the standard deviation of each regression coefficient using NCL. I tried to move the "reg_multlin" function in a loop over the number of observations:
>
> do nf = 0,nfils-1,1
> -> b_nf(:,nf) = reg_multlin(y, X(:,nf), False)
> end do
>
> fAODbeta(ns,ilat,ilon) = beta(1) + 0.
> fAODbeta_std(ns,ilat,ilon) = stddev(b_nf(1,:)) + 0.
>
> but I get the following error for the line indicated by an arrow (->)
>
> fatal:Number of dimensions in parameter (1) of (reg_multlin) is (1), (2) dimensions were expected
>
> Could you suggest me how to solve my problem?
> Or do you know a better way to estimate the p-value associated with each regression coefficients?
>
> Many thanks!
>
> Best regards,
> Susanna
> _______________________________________________
> ncl-talk mailing list
> List instructions, subscriber options, unsubscribe:
> http://mailman.ucar.edu/mailman/listinfo/ncl-talk
>
_______________________________________________
ncl-talk mailing list
List instructions, subscriber options, unsubscribe:
http://mailman.ucar.edu/mailman/listinfo/ncl-talk
- text/plain attachment: KENTUCKY.TXT
- text/plain attachment: ncl_talk.reg_multlin
- text/plain attachment: reg_multlin.ncl_talk.ncl