Date: Wed Jan 15 2014 - 18:53:44 MST
Hi, all:
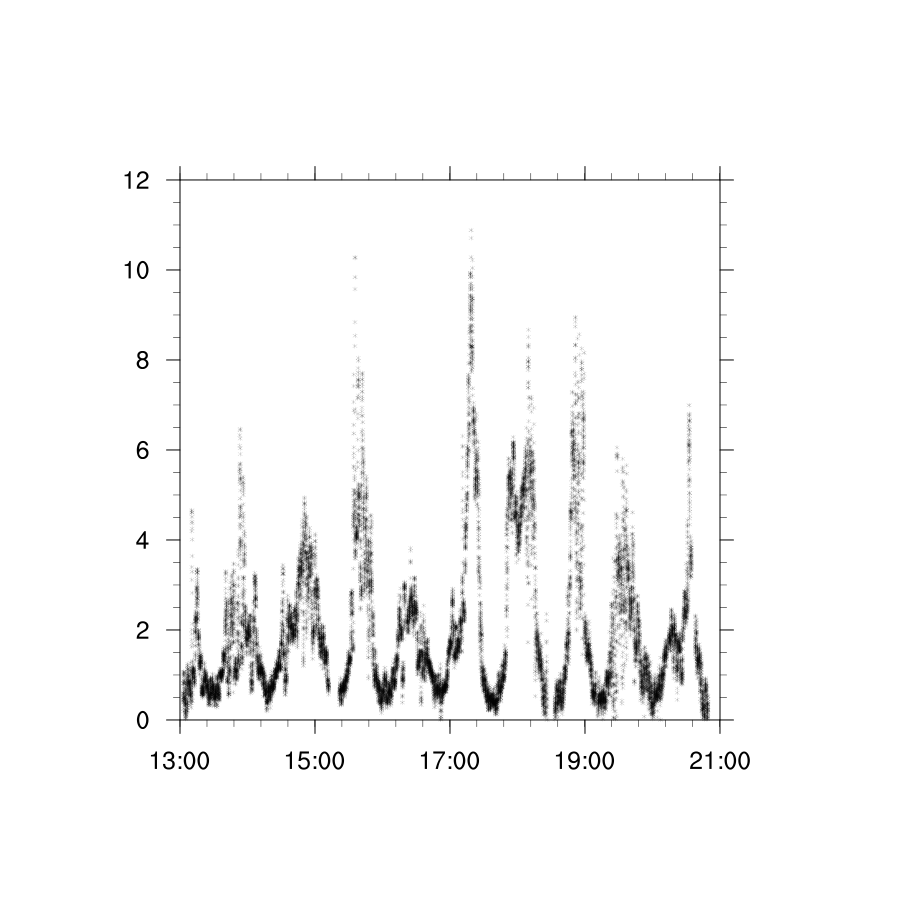
I am trying to plot an xy plot with time label x axis. The time data is UTC in secondes. I called ˇ°time_axis_labelsˇ± precedure. However, it seems that the plot is one hour shifted to the left. My first non-missing data value begins at 14:01:37 and the last ends at 21:37:13. However, the graph shows the time series begins right after 13:00:00 and ends before 21:00:00 . Please see the attached script, data file and plot.
thanks for any suggestions!
-----------------------------------------------------------------------------
Lijun Diao
ldiao@uh.edu
Research Assistant
Department of Earth & Atmospheric Sciences
University of Houston
4800 Calhoun RD., Bldg. S&R1-312
Houston, TX 77204-5007
_______________________________________________
ncl-talk mailing list
List instructions, subscriber options, unsubscribe:
http://mailman.ucar.edu/mailman/listinfo/ncl-talk