Date: Wed Feb 19 2014 - 08:03:20 MST
Dear Seniors,
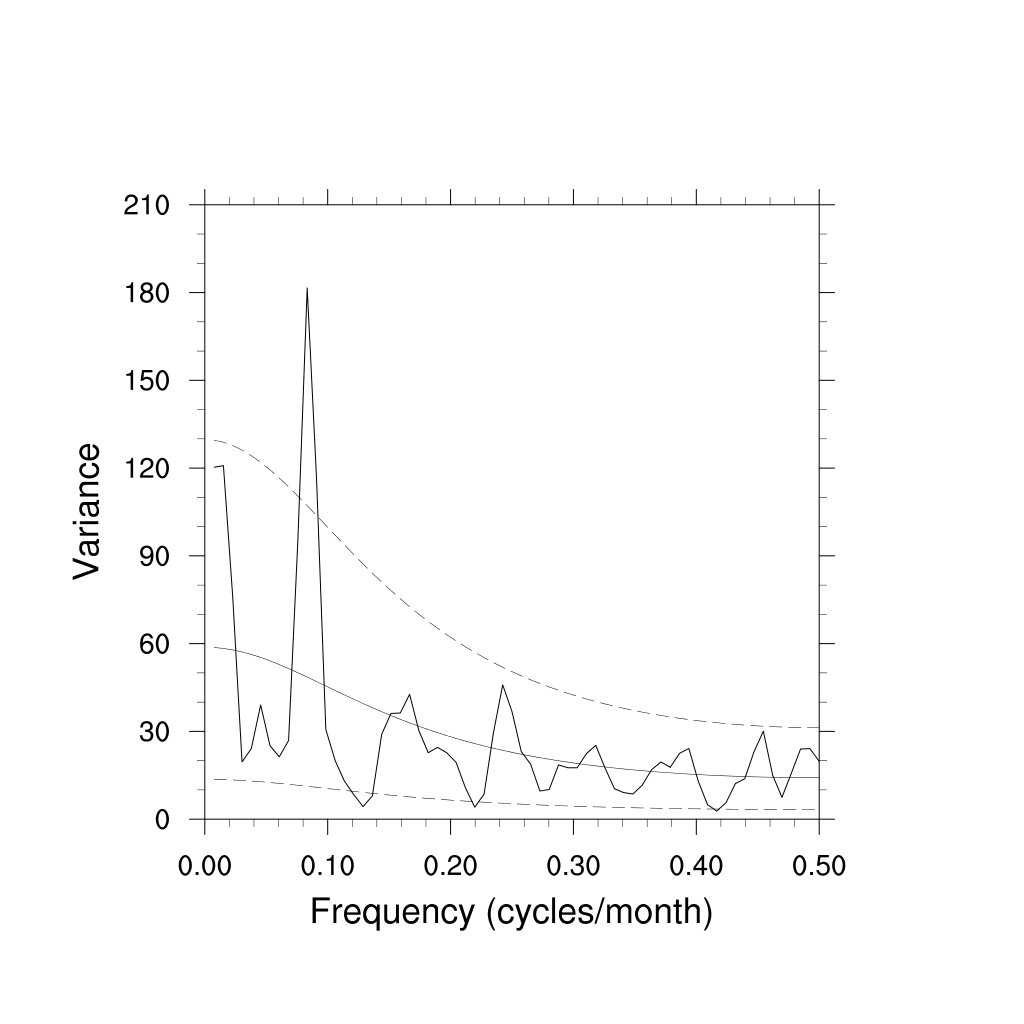
I have plotted the spectra plot which has
frequency(cycles/day) as x-axis and i want to add another x-axis [time
axis(days/cycles)] to the same plot. One more thing: is it possible to
avoid the red noise line in the output plot?. Herewith attached are plot
and script used for that plot. Thanks in advance.
regards,
Paul.
_______________________________________________
ncl-talk mailing list
List instructions, subscriber options, unsubscribe:
http://mailman.ucar.edu/mailman/listinfo/ncl-talk
- text/x-ncl attachment: spectra_rednoise_conf.ncl