Date: Mon Feb 24 2014 - 10:07:51 MST
Dear NCL,
Will helped me on this issue, but I still did not get the result as I
expected.
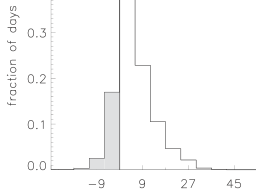
What I need is to shade the region below the XYBarchart outline that is
less than zero (value) indicating by xRefLine.
However, I have'nt got any trick, The example of the figure is in the
attachment.
I fully understand what Willi suggested by overlaying the histogram, but I
prefer to
have only the outline chart rather that the bar. Any helps would be really
appreciated.
Thanks for any tricks.
Best
_______________________________________________
ncl-talk mailing list
List instructions, subscriber options, unsubscribe:
http://mailman.ucar.edu/mailman/listinfo/ncl-talk