Date: Tue Mar 11 2014 - 01:59:04 MDT
Dear Arindam;
Thank you for reply. I got the following warning while running:
warning:_NhlCreateSplineCoordApprox: Attempt to create spline approximation for Y axis failed: consider adjusting trYTensionF value
warning:IrTransInitialize: error creating spline approximation for trYCoordPoints; defaulting to linear
I will take time if I define the tick as:
resTick@ttmValues = (/(/2008,01,01,00,00,00/), ; please make sure you change these dates according to your axis
а а а а а а а а а а а а а а а а а а а а а а(/2008,01,02,00,00,00/),
а а а а а а а а а а а а а а а а а а а а а а(/2008,01,03,00,00,00/)
а а а а а а а а а а а а а а а а а а а а а/)
Because the data line is more than hundred.
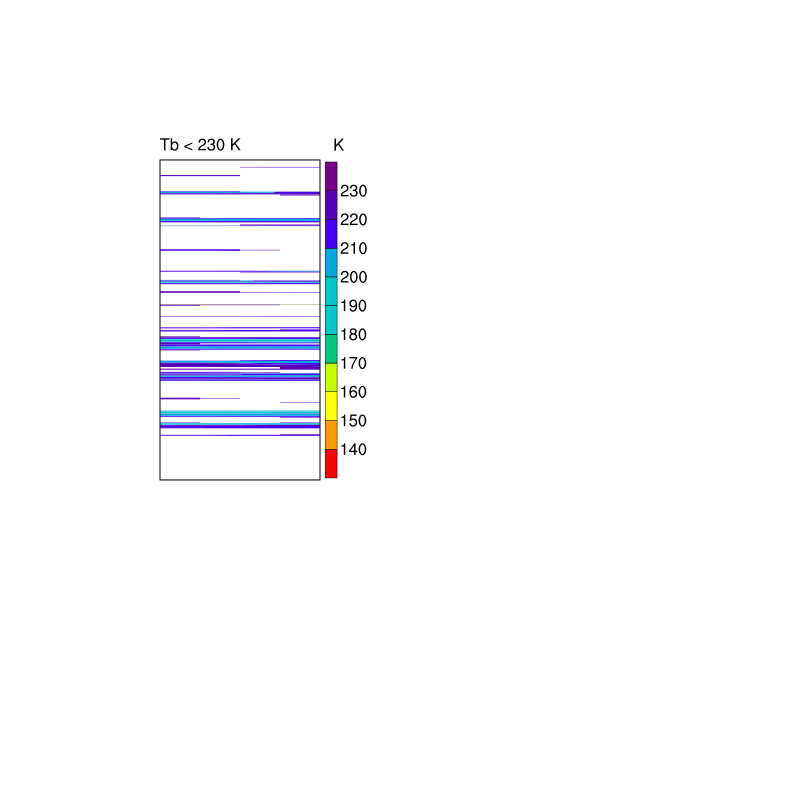
I send the result as the attached file. Thank you again.
Juki
On Tuesday, March 11, 2014 1:30 PM, Arindam Chakraborty <arch13@gmail.com> wrote:
Hi Juki Juki,
аnot appearance of tick marks could be due to more than one reasons. Do you have sufficient space between the axis and the left most margin of the plot area? You can also try usingаttmValues to tick at the locations you want exactly. For example:
а resTick а а а а а а а а= True
а resTick@ttmFormat а а а= "%d %c"
а resTick@ttmAxis а а а а= "YL"
а resTick@ttmValues = (/(/2008,01,01,00,00,00/), ; please make sure you change these dates according to your axis
а а а а а а а а а а а а а а а а а а а а а а(/2008,01,02,00,00,00/),
а а а а а а а а а а а а а а а а а а а а а а(/2008,01,03,00,00,00/)
а а а а а а а а а а а а а а а а а а а а а/)
аа
а time_axis_labels(data&time, res, resTick )
...
About your 2nd question, please see how to format tick marks, in ncl resources documentation. You might useаtmXBFormat here.
regards,
--Dr Arindam Chakraborty
CAOS, IISc, Bangalore-12
On Tue, Mar 11, 2014 at 10:55 AM, juki juki <juky_emc2@yahoo.com> wrote:
Dear All;
>
>
>I try to visualize my data to longitude versus time plot (code is given below). I use simple command as time_axis_labels(data&time, res, resTick ). However, the tick for the y axis (time) does not appear. Another question, the longitude (X-axis) is very narrow area (100.225 - 100.475 E). How to make the tick mark visible for such narrow longitude ?
>
>
>Thanks for help
>joeky
>
>
>
>
>
>
>------------------------
>load "$NCARG_ROOT/lib/ncarg/nclscripts/csm/gsn_code.ncl"
load "$NCARG_ROOT/lib/ncarg/nclscripts/csm/gsn_csm.ncl"
load "$NCARG_ROOT/lib/ncarg/nclscripts/contrib/time_axis_labels.ncl"
load "$NCARG_ROOT/lib/ncarg/nclscripts/csm/contributed.ncl" begin
; read in data ncols = 9 ; nrows = 596 ; data1 = asciiread ("CPEA2004_Ayu_230.txt", (/nrows,ncols/), "float") ; For data yyyy = floattointeger(data1(:,0)+2000); mm = floattointeger(data1(:,1)); dd = floattointeger(data1(:,2)); hh = floattointeger(data1(:,3)); mn = floattointeger(fspan(0, 0, 596)) sd = floattointeger(fspan(0, 0, 596)) data=data1(:,4:8) if (any(isnan_ieee(data))) then value = 1.e20 replace_ieeenan (data, value, 0) data@_FillValue = value end if time=new(dimsizes(yyyy),double) time@units = "days since 1800-01-01 00:00:00" do i=0,dimsizes(yyyy)-1 time(i)=cd_inv_calendar(yyyy(i), mm(i),dd(i),hh(i),mn(i),sd(i),time@units, 0) end do lon = fspan(100.225,100.475, ncols-4) lon!0 = "lon" lon@units = "degrees_east" data!0 = "time" data!1 = "lon" data&time = time data&lon = lon data@long_name = "(a) Tb < 230 K" data@units = "K" wks = gsn_open_wks ("png", "hovTBB"
) ; open ps file gsn_define_colormap(wks, "cosam") ; choose colormap gsn_reverse_colormap(wks) setvalues NhlGetWorkspaceObjectId() "wsMaximumSize" : 600000000 end setvalues res = True ; plot mods desired res@cnFillOn = True ; turn on color fill ; res@gsnSpreadColors = False ; use full range of colors res@cnLinesOn = False res@vpWidthF = 0.2 res@vpHeightF = 0.4 res@trYReverse = True ; res@tiMainString = "WESTWARD" ; title res@cnLevelSelectionMode = "ManualLevels" ; manual contour levels res@cnMinLevelValF = 140. ; min level res@cnMaxLevelValF = 230 ; max level ; res@cnLevelSpacingF = 10 ; contour level spacing res@pmLabelBarWidthF = 0.05 res@pmLabelBarHeightF = 0.4 res@lbOrientation = "Vertical" res@pmLabelBarOrthogonalPosF = -0.03 ; move label bar
closer res_at_lbLabelStride = 1 ; res_at_mpMinLonF = 80. ; res_at_mpMaxLonF = 130. res_at_txFontHeightF = 0.02 ; resize the text ; res_at_lbLabelFontHeightF = 0.02 ; res_at_gsnMajorLonSpacing = 10 ; res_at_gsnSpreadColorStart = -1 ; start with last color
; res_at_gsnSpreadColorEnd = 2 ; end with a beginning color res_at_gsnStringFontHeightF = 0.015 ; now change the size of the tickmark labels res_at_tmXBLabelFontHeightF = 0.015 ; resize tick labels res_at_tmYLLabelFontHeightF = 0.015 res_at_lbLabelFontHeightF = 0.015 res_at_gsnLeftString = "Tb < 230 K" res_at_gsnRightString = "K" res_at_gsnRightStringParallelPosF=1.15 resTick = True resTick_at_ttmFormat = "%d %c" resTick_at_ttmAxis = "YL" resTick_at_ttmMajorStride = 48 time_axis_labels(data&time, res, resTick ) plot = gsn_csm_hov(wks, data, res) end
>
>
>
>
>
>
>
>
>
>
>
>
>
>
>
>
>
>
>
>_______________________________________________
>ncl-talk mailing list
>List instructions, subscriber options, unsubscribe:
>http://mailman.ucar.edu/mailman/listinfo/ncl-talk
>
>
_______________________________________________
ncl-talk mailing list
List instructions, subscriber options, unsubscribe:
http://mailman.ucar.edu/mailman/listinfo/ncl-talk