Date: Mon Mar 24 2014 - 13:17:31 MDT
Hi Everyone,
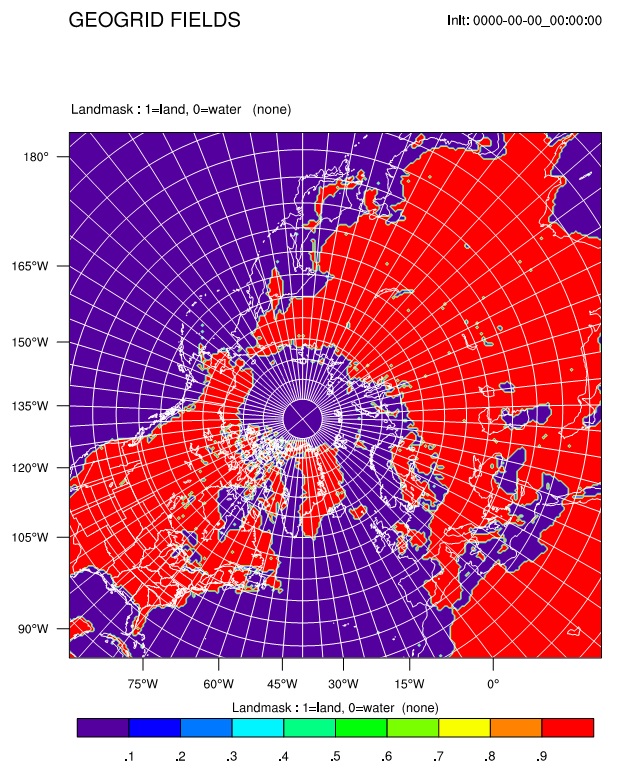
Recently I have noticed an issue with my wps plots. The landmask output
from the geo_em.d01 and the map lines from ncl are very different. Please
see the attached plot. For example for Japan the landmask(red) and the ncl
map borders (white)are very different.
I highly appreciate your comments on this issue.
I am trying to make a polar stereographic plot with the following
namelist.wps options:
&geogrid
parent_id = 1,
parent_grid_ratio = 1,
i_parent_start = 1,
j_parent_start = 1,
e_we = 250,
e_sn = 250,
geog_data_res = '10m',
dx = 60000,
dy = 60000,
map_proj = 'polar',
ref_lat = 83.00,
ref_lon = 110.00,
truelat1 = 90.0,
truelat2 = 90.0,
stand_lon = -40.0,
/
and the ncl script I used is :(from:
http://www.mmm.ucar.edu/wrf/OnLineTutorial/Graphics/NCL/Examples/BASIC/wrf_wps_ter4.ncl
)
load "$NCARG_ROOT/lib/ncarg/nclscripts/csm/gsn_code.ncl"
load "$NCARG_ROOT/lib/ncarg/nclscripts/wrf/WRFUserARW.ncl" ; Add
special wrf functions
begin
a = addfile("./geo_em.d01.nc","r") ; Open a file
type = "x11"
wks = gsn_open_wks(type,"plt_geo_4") ; Create a plot workstation
opts = True ; Set some Basic Plot options
opts@MainTitle = "GEOGRID FIELDS"
ter = a->LANDMASK(0,:,:) ; Read the variable to memory
res = opts ; Use basic options for this field
res@cnFillOn = True ; Create a color fill plot
contour = wrf_contour(a,wks,ter,res)
pltres = True ; Set plot options
mpres = True ; Set map options
plot = wrf_map_overlays(a,wks,(/contour/),pltres,mpres) ; Plot the
data over a map background
end
Regards,
Negin
_______________________________________________
ncl-talk mailing list
List instructions, subscriber options, unsubscribe:
http://mailman.ucar.edu/mailman/listinfo/ncl-talk