Date: Tue Apr 15 2014 - 20:46:55 MDT
Hi,all
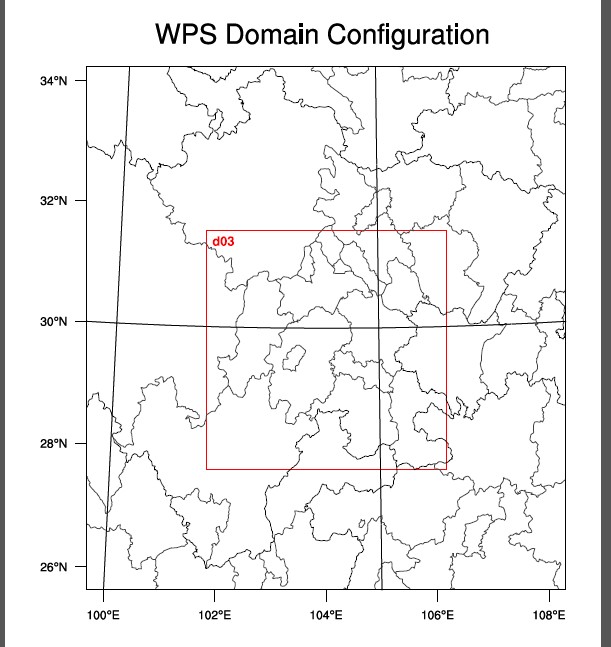
I want to plot corresponding domains and add shapefile outlines using gsn_add_shapefile_polylines.But the map only has d03 without d02.The script is attached. I will very much appreciate your help to resolve this.
And is it possible to display the d01 in the plot?
; Script display location of model domains
; Only works for ARW domains
; Reads namelist file directly
load "$NCARG_ROOT/lib/ncarg/nclscripts/csm/gsn_code.ncl"
load "$NCARG_ROOT/lib/ncarg/nclscripts/wrf/WRFUserARW.ncl"
;load "./WRFUserARW.ncl"
begin
;
; We generate plots, but what kind do we prefer?
type = "pdf"
; type = "pdf"
; type = "ps"
; type = "ncgm"
wks = gsn_open_wks(type,"wps_show_dom")
; read the following namelist file
filename = "/home/Huanglei/wps/namelist.wps"
; Set the colors to be used
colors = (/"white","black","White","ForestGreen","DeepSkyBlue","Red","Blue"/)
gsn_define_colormap(wks, colors)
; Set some map information ; line and text information
mpres = True
mpres@mpFillOn = True
mpres@mpFillColors = (/"background","DeepSkyBlue","ForestGreen","DeepSkyBlue", "transparent"/)
mpres@mpGeophysicalLineColor = "Black"
mpres@mpGridLineColor = "Black"
mpres@mpLimbLineColor = "Black"
mpres@mpNationalLineColor = "Black"
mpres@mpPerimLineColor = "Black"
mpres@mpUSStateLineColor = "Black"
;mpres@mpGridSpacingF = 45
mpres@tiMainString = " WPS Domain Configuration "
mpres@mpOutlineOn = False ; Turn off map outlines
mpres@mpFillOn = False ; Turn off map fill
lnres = True
lnres@gsLineThicknessF = 2.5
lnres@domLineColors = (/ "white", "Red" , "Red" , "Blue" /)
txres = True
txres@txFont = "helvetica-bold"
;txres@txJust = "BottomLeft"
txres@txJust = "TopLeft"
txres@txPerimOn = False
txres@txFontHeightF = 0.015
;;;;;;;;;;;;;;;;;;;;;;;;;;;;;;;;;;;;;;;;;;;;;;;;;;;;;;;;;;;;;;;;
; Do not change anything between the ";;;;;" lines
mpres@mpOutlineOn = False ; Turn off map outlines
mpres@mpFillOn = False ; Turn off map fill
mpres@max_dom = stringtoint (systemfunc("grep max_dom " +filename+ " | cut -f2 -d'=' | cut -f1 -d','" ) )
mpres@dx = stringtofloat(systemfunc("grep dx " +filename+ " | cut -f2 -d'=' | cut -f1 -d','" ) )
mpres@dy = stringtofloat(systemfunc("grep dy " +filename+ " | cut -f2 -d'=' | cut -f1 -d','" ) )
mpres@ref_lat = stringtofloat(systemfunc("grep ref_lat " +filename+ " | cut -f2 -d'=' | cut -f1 -d','" ) )
mpres@ref_lon = stringtofloat(systemfunc("grep ref_lon " +filename+ " | cut -f2 -d'=' | cut -f1 -d','" ) )
test = systemfunc("grep truelat1 " +filename )
if ( .not. ismissing(test) )
mpres@truelat1 = stringtofloat(systemfunc("grep truelat1 " +filename+ " | cut -f2 -d'=' | cut -f1 -d','" ) )
else
mpres@truelat1 = 0.0
end if
test = systemfunc("grep truelat2 " +filename )
if ( .not. ismissing(test) )
mpres@truelat2 = stringtofloat(systemfunc("grep truelat2 " +filename+ " | cut -f2 -d'=' | cut -f1 -d','" ) )
else
mpres@truelat2 = 0.0
end if
mpres@stand_lon = stringtofloat(systemfunc("grep stand_lon " +filename+ " | cut -f2 -d'=' | cut -f1 -d','" ) )
test = systemfunc("grep lambert " +filename )
if ( .not. ismissing(test) )
mpres@map_proj = "lambert"
end if
test = systemfunc("grep mercator " +filename )
if ( .not. ismissing(test) )
mpres@map_proj = "mercator"
end if
test = systemfunc("grep polar " +filename )
if ( .not. ismissing(test) )
mpres@map_proj = "polar"
end if
testa = systemfunc("grep 'lat-lon' " +filename )
if ( .not. ismissing(testa) )
mpres@map_proj = "lat-lon"
mpres@pole_lat = stringtofloat(systemfunc("grep pole_lat " +filename+ " | cut -f2 -d'=' | cut -f1 -d','" ) )
mpres@pole_lon = stringtofloat(systemfunc("grep pole_lon " +filename+ " | cut -f2 -d'=' | cut -f1 -d','" ) )
end if
parent_id = new ( mpres@max_dom , integer )
parent_grid_ratio = new ( mpres@max_dom , integer )
i_parent_start = new ( mpres@max_dom , integer )
j_parent_start = new ( mpres@max_dom , integer )
e_we = new ( mpres@max_dom , integer )
e_sn = new ( mpres@max_dom , integer )
do n = 1, mpres@max_dom
n0 = n - 1
parent_id(n0) = stringtoint(systemfunc("grep parent_id " +filename+ " | cut -f2 -d'=' | cut -f"+n+" -d','" ) )
parent_grid_ratio(n0) = stringtoint(systemfunc("grep parent_grid_ratio " +filename+ " | cut -f2 -d'=' | cut -f"+n+" -d','" ) )
i_parent_start(n0) = stringtoint(systemfunc("grep i_parent_start " +filename+ " | cut -f2 -d'=' | cut -f"+n+" -d','" ) )
j_parent_start(n0) = stringtoint(systemfunc("grep j_parent_start " +filename+ " | cut -f2 -d'=' | cut -f"+n+" -d','" ) )
e_we(n0) = stringtoint(systemfunc("grep e_we " +filename+ " | cut -f2 -d'=' | cut -f"+n+" -d','" ) )
e_sn(n0) = stringtoint(systemfunc("grep e_sn " +filename+ " | cut -f2 -d'=' | cut -f"+n+" -d','" ) )
end do
mpres@parent_id = parent_id
mpres@parent_grid_ratio = parent_grid_ratio
mpres@i_parent_start = i_parent_start
mpres@j_parent_start = j_parent_start
mpres@e_we = e_we
mpres@e_sn = e_sn
mpres@mpOutlineOn = False ; Turn off map outlines
mpres@mpFillOn = False ; Turn off map fill
mp = wrf_wps_dom (wks,mpres,lnres,txres)
shp_name1 = "/home/Huanglei/map/China/diquJie_polyline.shp"
lnres = True
lnres@gsLineColor = "gray25"
lnres@gsLineThicknessF = 0.5
id = gsn_add_shapefile_polylines(wks,mp,shp_name1,lnres)
shp_name2 = "/home/Huanglei/map/China/cnmap/cnhimap.shp"
prres=True
prres@gsLineThicknessF = 2.0
prres@gsLineColor = "black"
plotcn3 = gsn_add_shapefile_polylines(wks,mp,shp_name2,prres)
draw(mp) ; This will draw the map and the shapefile outlines.
;;;;;;;;;;;;;;;;;;;;;;;;;;;;;;;;;;;;;;;;;;;;;;;;;;;;;;;;;;;;;;;;
; Now you can add some information to the plot.
; Below is an example of adding a white dot over the DC location.
;pmres = True
;pmres@gsMarkerColor = "White"
;pmres@gsMarkerIndex = 16
;pmres@gsMarkerSizeF = 0.01
;gsn_polymarker(wks,mp,-77.26,38.56,pmres)
frame(wks) ; lets frame the plot - do not delete
end
_______________________________________________
ncl-talk mailing list
List instructions, subscriber options, unsubscribe:
http://mailman.ucar.edu/mailman/listinfo/ncl-talk