Date: Mon Apr 21 2014 - 14:39:42 MDT
Hi ncl-talk,
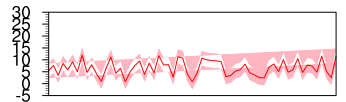
I have a time series of a value (AM_1), to which I want to add and deduct
the standard deviation that will show its spread. I want to have a line
plotted over the shaded spread. I tried modifying the code following the
example (http://www.ncl.ucar.edu/Applications/Scripts/polyg_5.ncl), but I
can't get it to work correctly. Could you please take a quick look and
suggest the way to fix it?
I have a one dimensional array with 61 values - called "AM_1"
AM_1_st = dim_stddev_n_Wrap(AM_1,0) ; calculate the standard deviation of
AM_1
xp=new((/61/), float) ; set up the array for the polygon "AM_1 + stand.
deviation"
yp=new((/61/),float) ; set up the array for the polygon "AM_1 - stand.
deviation"
do xx= 0,60
xp(xx)=AM_1(xx)+AM_1_st
yp(xx)=AM_1(xx)-AM_1_st
end do
x=ispan(1948,2008,1)
res@gsnDraw = False
res@gsnFrame = False
res@xyLineThicknessF = 2.
res@tfPolyDrawOrder = "Predraw"
plot(0) = gsn_csm_xy(wks,x,AM_1,res)
gsres = True
gsres@gsFillColor = "LightPink"
dummy = gsn_add_polygon(wks,plot(0),x,xp,gsres) ; draw a polygon above the
original array (array+stand deviation)
dummy1 = gsn_add_polygon(wks,plot(0),x,yp,gsres) ; draw a polygon below
the original array (array-stand deviation)
I attached the plot of what happens when I compile my code. It looks to me
that the polygons are drawn to the time series of "AM_1+st deviation" and
not to the AM_1.
regards,
Alex
_______________________________________________
ncl-talk mailing list
List instructions, subscriber options, unsubscribe:
http://mailman.ucar.edu/mailman/listinfo/ncl-talk