Date: Thu Apr 24 2014 - 20:38:08 MDT
Hi,all:
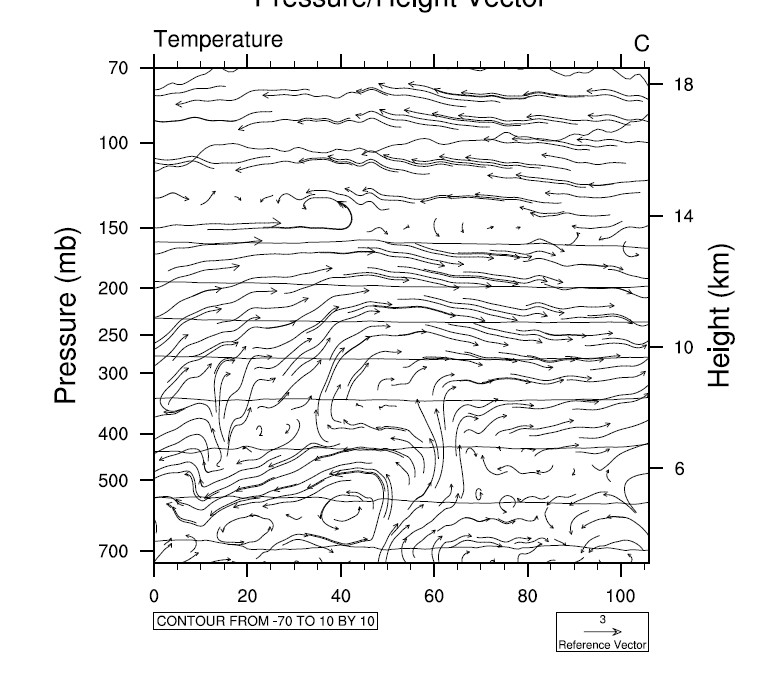
I have plotted a pressure/height contour plot overlaid with vectors according to the vecor_5.ncl on the NCL web.But I want to remove the tempreture contour line from the picture(just vectors needed).I set the res@cnFillOn to false,and try to set the ContourParameters beyond the tempreture range ,but the contour line still there.
warning:ContourParameters is not a valid resource in vector23_contour at this time.
Could you help me to remove the tempreture contour line from the picture?
this is my script:
;----------------------------------------------------------------------
; vector_5.ncl
;
; Concepts illustrated:
; - Drawing pressure/height vectors over filled contours
; - Using "vinth2p" to interpolate to user specified pressure levels
; - Drawing curly vectors
; - Thinning vectors using a minimum distance resource
;----------------------------------------------------------------------
load "$NCARG_ROOT/lib/ncarg/nclscripts/csm/gsn_code.ncl"
load "$NCARG_ROOT/lib/ncarg/nclscripts/csm/gsn_csm.ncl"
load "$NCARG_ROOT/lib/ncarg/nclscripts/csm/contributed.ncl"
load "$NCARG_ROOT/lib/ncarg/nclscripts/wrf/WRFUserARW.ncl"
begin
; file handling
;************************************************
; define filename
a = addfile("/home/Huanglei/data/d032"+".nc","r") ; open netcdf file
;************************************************
; read needed variables from file
;************************************************
times = wrf_user_getvar(a,"times",-1) ; get times in the file
ntimes = dimsizes(times) ; number of times in the file
mdims = getfilevardimsizes(a,"P") ; get some dimension sizes for the file
nd = dimsizes(mdims)
wks = gsn_open_wks ("pdf", "vector23" ) ; open workstation
gsn_define_colormap(wks,"BlAqGrYeOrRevi200") ; choose color map
;---------------------------------------------------------------
do it = 48,ntimes-1,1 ; TIME LOOP
print("Working on time: " + times(it) )
res = True ; plot mods desired
res@tiMainString = times(it) ; Set Valid time to use on plots
tc = wrf_user_getvar(a,"tc",it) ; T in C
v = wrf_user_getvar(a,"V",it) ; v wind
w := wrf_user_getvar(a,"W",it) ; w wind
p = wrf_user_getvar(a, "pressure",it) ; grid point height
z = wrf_user_getvar(a, "z",it) ; grid point height
w := wrf_user_unstagger(w, w@stagger)
; tc := wrf_user_unstagger(tc, tc@stagger)
; v := wrf_user_unstagger(v, v@stagger)
plane = new(4,float)
plane = (/ 75,132, 141,217 /)
opts=True
t_plane = wrf_user_intrp3d(tc,p,"v",plane,0.,opts)
v_plane = wrf_user_intrp3d(v,p,"v",plane,0.,opts)
w_plane = wrf_user_intrp3d(w,p,"v",plane,0.,opts)
p_plane = wrf_user_intrp3d(p,p,"v",plane,0.,opts)
;************************************************
; Omega is significantly smaller than v, so we will
; scale it so that some vertical motion is visible
;************************************************
wAve = avg(w_plane(:,104)) ; used for scaling
vAve = avg(v_plane(:,104))
scale = fabs(vAve/wAve)
wscale = w_plane*scale ; now scale
t_plane!0="level"
t_plane&level=p_plane(:,0)
copy_VarCoords(t_plane, v_plane)
copy_VarCoords(t_plane, wscale) ; copy coordinate variables
; printVarSummary(v_plane)
; printVarSummary(t_plane)
; printVarSummary(wscale)
; printVarSummary(p_plane)
; print(p_plane(:,0))
;print(p(:, 0, 0))
; print(z(:, 0, 0))
; print(tc(:, 0, 0))
; print(v(:, 0, 0))
;***********************************************
; create plot
;***********************************************
res@tiMainString = "Pressure/Height Vector" ; title
res@tiYAxisString = "Pressure (mb)"
res@cnLineLabelsOn = False ; turn off line labels
res@cnFillOn = False ; turn on color fill
res@ContourParameters = (/ -20., 0., 10./)
res@lbLabelStride = 2 ; every other color
res@gsnSpreadColors = True ; use full range of color map
res@vcRefMagnitudeF = 3.0 ; define vector ref mag
res@vcRefLengthF = 0.045 ; define length of vec ref
res@vcGlyphStyle = "CurlyVector" ; turn on curley vectors
res@vcMinDistanceF = 0.03 ; thin out vectors
res@vcMapDirection = False
;*****************************************************
; draw plot from pole to pole at 170E
;*****************************************************
plot = gsn_csm_pres_hgt_vector(wks,t_plane(24:,:),v_plane(24:,:),wscale(24:,:),res )
end do
end
_______________________________________________
ncl-talk mailing list
List instructions, subscriber options, unsubscribe:
http://mailman.ucar.edu/mailman/listinfo/ncl-talk