Date: Thu May 01 2014 - 06:26:34 MDT
Hi All
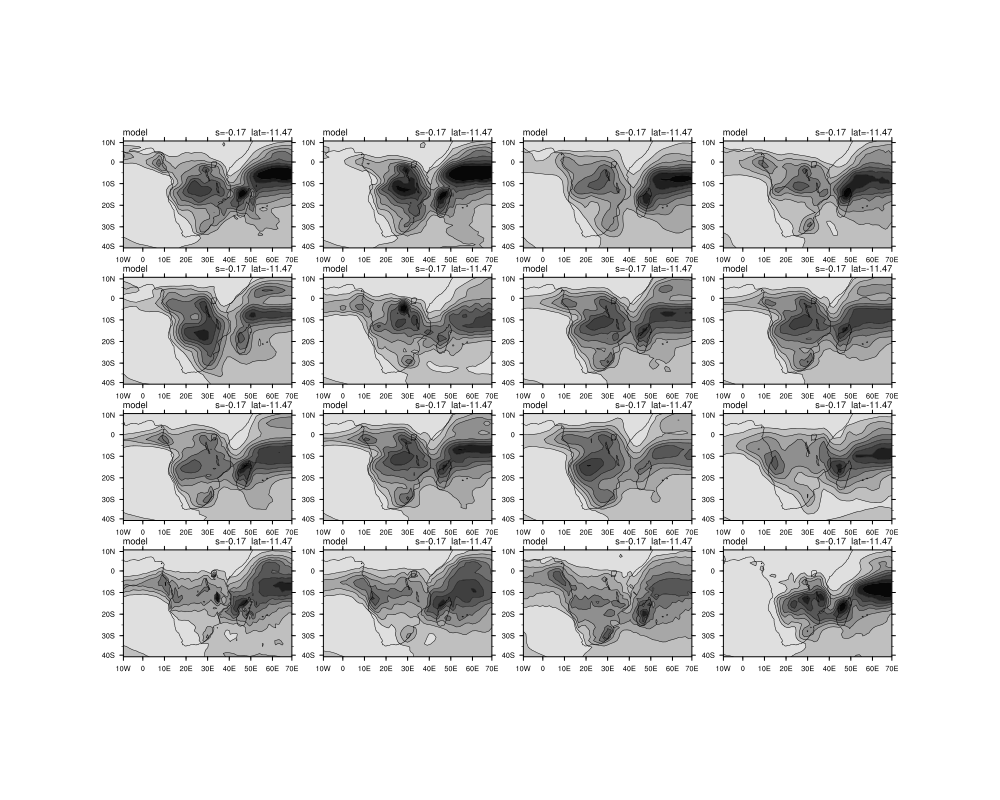
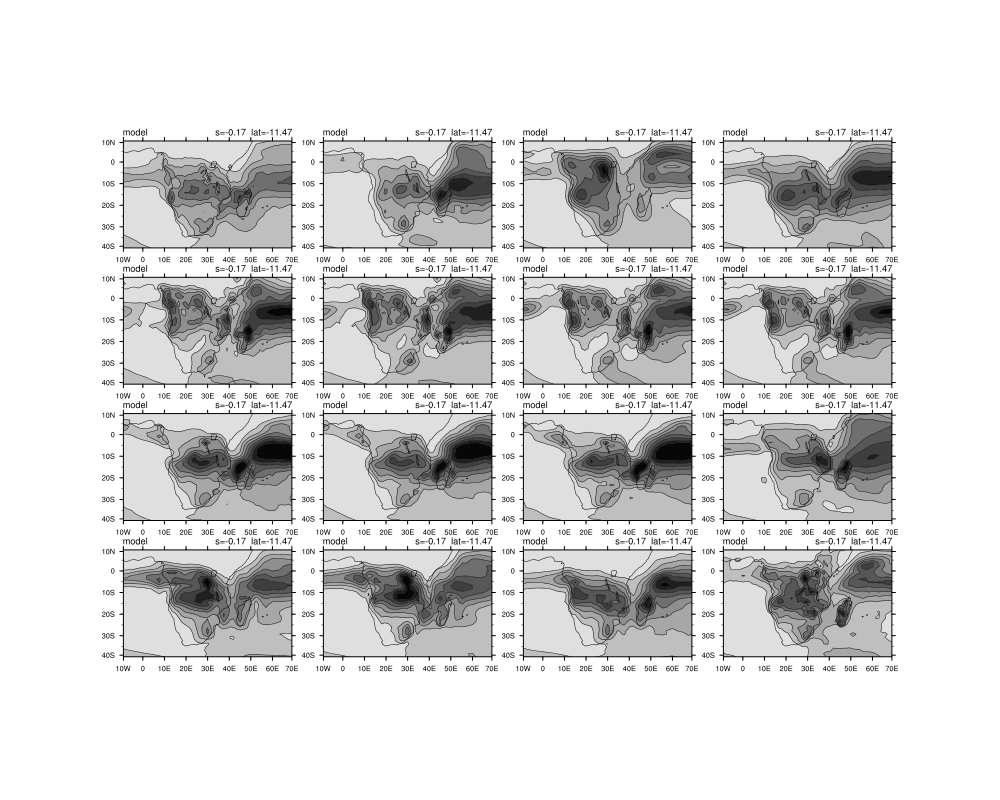
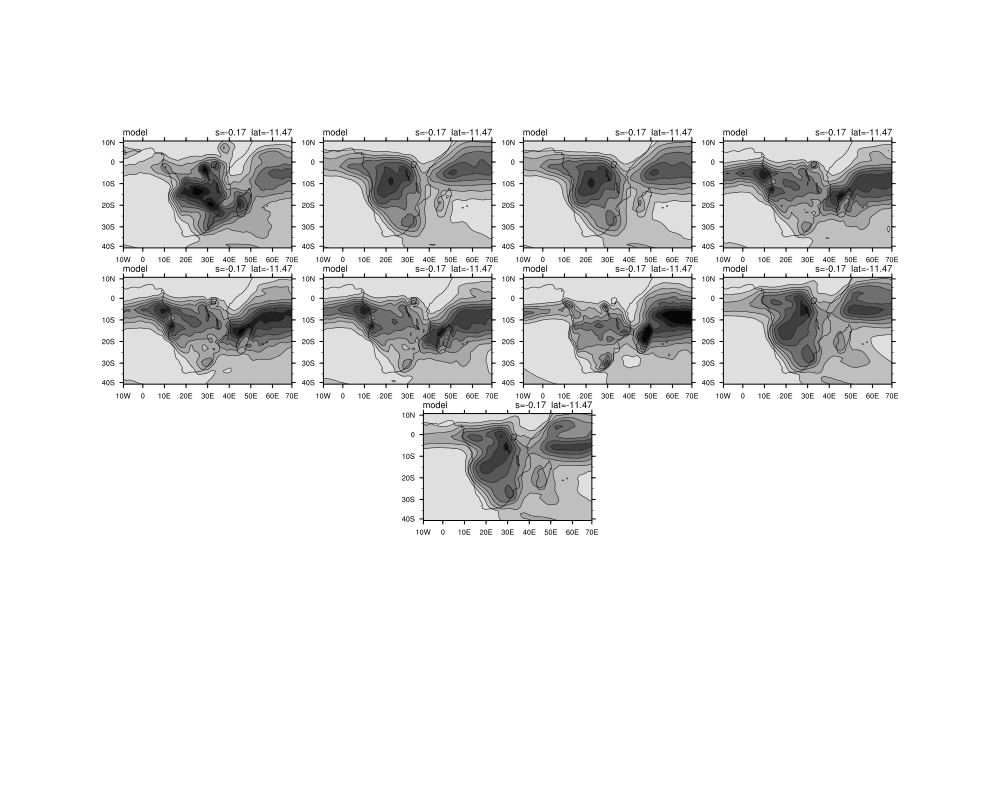
I am trying to display 44 panel plots and have managed to show 41 of them as three of them have one less dimension and are therefore not able to run in the loop I created.
How do I go about including the 3 models with 1 less dimension size? Should I use if statements?
Another question is that I want each model name to display above the correct panel plot, how do I go about this? I have an array called model with all the model names in it.
I am also battling to do the overlay plots in the loop. My script is below and I have attached the figures that are outputed currently.
Many thanks for your help in advance.
Kind Regards
Melissa
code
;*************************************************
; regline_panel plots.ncl
;
;*************************************************
load "$NCARG_ROOT/lib/ncarg/nclscripts/csm/gsn_code.ncl"
load "$NCARG_ROOT/lib/ncarg/nclscripts/csm/gsn_csm.ncl"
load "$NCARG_ROOT/lib/ncarg/nclscripts/csm/contributed.ncl"
begin
;************************************************
; Read in Precip Data.
;************************************************
;Models
model = (/"ACCESS1-0","ACCESS1-3","bcc-csm1-1","bcc-csm1-1-m","BNU-ESM","CanESM2","CCSM4","CESM1-BGC","CESM1-CAM5","CESM1-FASTCHEM","CESM1-WACCM","CMCC-CESM","CMCC-CM","CMCC-CMS","CNRM-CM5","CSIRO-Mk3-6-0","EC-EARTH","FGOALS-s2","FIO-ESM","GFDL-CM3","GISS-E2-H_p1","GISS-E2-H-CC_p1","GISS-E2-R_p1","GISS-E2-R-CC_p1","HadGEM2-AO","HadGEM2-CC","HadGEM2-ES","inmcm4","IPSL-CM5A-LR","IPSL-CM5A-MR","IPSL-CM5B-LR","MIROC4h","MIROC5","MIROC-ESM","MIROC-ESM-CHEM","MPI-ESM-LR","MPI-ESM-MR","MPI-ESM-P","MRI-CGCM3","NorESM1-M","NorESM1-ME"/)
;"FGOALS-g2","GFDL-ESM2G","GFDL-ESM2M",
wks = gsn_open_wks("X11","Model_regline_panel") ; specifies a plot
gsn_define_colormap(wks,"gsltod") ; choose color map
plot = new (dimsizes(model),"graphic")
do gg = 0,dimsizes(model)-1
; read in model data
in=addfile("/mnt/geog/ml382/melphd/regressionline/siczoutputprregline99/pr_Amon_"+model(gg)+"_historical_safrica_climDJF1.nc","r")
lat = in->lat ; get lat
lon = in->lon ; get lon
time = in->time ; get time
;level = in->z ; get level
pr = in->pr
pr1 = in->pr(:,0,:,:)
pr2 = pr1(time|0, {lat|-30:0}, {lon|10:50})
dimpr2 = dimsizes(pr2)
nlat = dimpr2(0)
mlon = dimpr2(1)
pr2MaxLon = new ( mlon, typeof(pr2), pr2@_FillValue)
do ml=0,mlon-1
imax = maxind(pr2(:,ml))
pr2MaxLon(ml) = dble2flt(lat(imax))
end do
print(pr2MaxLon)
print(pr2&lon)
print("-------------------------------")
print("pr2MaxLon: "+pr2&lon+" "+pr2MaxLon)
;Regression Line
rcMaxLon = regline(pr2&lon,pr2MaxLon)
print(rcMaxLon)
print(rcMaxLon@yave)
bMaxLon = rcMaxLon@yintercept
print(bMaxLon)
xMaxLon = pr2&lon
print(xMaxLon)
yMaxLon = rcMaxLon*pr2&lon + bMaxLon
print(yMaxLon)
print("-------------------------------")
print(xMaxLon+" "+yMaxLon)
;************************************************
; create an array to hold both the original data
; and the calculated regression line
;************************************************
data = new ( (/2,dimsizes(pr2MaxLon)/), typeof(pr2MaxLon))
data(1,:) = dble2flt(rcMaxLon)*(dble2flt(xMaxLon)-dble2flt(rcMaxLon@xave)) + dble2flt(rcMaxLon@yave)
;************************************************
; Read in Precip Data with larger domain.
;************************************************
f=addfile("/mnt/geog/ml382/melphd/regressionline/siczoutputprregline2/pr_Amon_"+model(gg)+"_historical_safrica_climDJF1.nc","r")
lat1 = f->lat ; get lat
lon1 = f->lon ; get lon
time1 = f->time
pr6 = f->pr(:,0,:,:)
pr4 = pr6(time|0,{lat|-40:10}, {lon|-10:70})
;************************************************
; Read in Precip Data.
;************************************************
;Obs
cin = addfile("/mnt/nfs2/geog/ml382/melphd/regressionline/cmap61.nc","r")
prcmap = cin->precip(:,:,:)
pr5 = prcmap(time|0, {lat|-30:0}, {lon|10:50})
;fili = "/mnt/nfs2/geog/ml382/melphd/regressionline/cmap61.nc" ; data
;f = addfile (fili , "r") ; add file
lat = cin->lat ; get lat
lon = cin->lon ; get lon
time = cin->time ; get time
;level = f->z ; get level
;pr6 = f->precip ; get precip
;printVarSummary(pr6)
;*************************************************************
;Calculations of max precip for lat and lon values
;**************************************************************
dimpr5 = dimsizes(pr5)
nlat = dimpr5(0)
mlon = dimpr5(1)
pr5MaxLon = new ( mlon, typeof(pr5), pr5@_FillValue)
do ml=0,mlon-1
imax = maxind(pr5(:,ml))
pr5MaxLon(ml) = dble2flt(lat(imax))
end do
print(pr5MaxLon)
print(pr5&lon)
print("-------------------------------")
print("pr5MaxLon: "+pr5&lon+" "+pr5MaxLon)
;Regression Line
regcMaxLon = regline(pr5&lon,pr5MaxLon)
print(regcMaxLon)
print(regcMaxLon@yave)
bMaxLon = regcMaxLon@yintercept
print(bMaxLon)
xMaxLon = pr5&lon
print(xMaxLon)
yMaxLon = regcMaxLon*pr5&lon + bMaxLon
print(yMaxLon)
print("-------------------------------")
print(xMaxLon+" "+yMaxLon)
;************************************************
; create an array to hold both the original data
; and the calculated regression line
;************************************************
datac = new ( (/2,dimsizes(pr5MaxLon)/), typeof(pr5MaxLon))
datac(1,:) = dble2flt(regcMaxLon)*(dble2flt(xMaxLon)-dble2flt(regcMaxLon@xave)) + dble2flt(regcMaxLon@yave)
; resource lists
res = True ; plot mods desired
res@gsnAddCyclic = False
res@cnFillOn = True ; color on
res@lbLabelStride = 2 ; every other label
res@gsnSpreadColors = True ; use full range of color map
res@cnLineLabelsOn = False ; no contour line labels
res@lbLabelBarOn = False
res@gsnDraw = False ; do not draw the plot
res@gsnFrame = False
pr4 = pr6(0,{-40:10},{-10:70})
dimpr4 = dimsizes(pr4)
latn = dimpr4(0)
lonm = dimpr4(1)
res@mpLimitMode = "Corners" ;
res@mpLeftCornerLonF = lon1(0)
res@mpRightCornerLonF = lon1(lonm-1)
res@mpLeftCornerLatF = lat1(0)
res@mpRightCornerLatF = lat1(latn-1)
res@tmXBMode = "Explicit" ; Define own tick mark labels.
res@tmXBValues = (/ -9.,0.,10.,20.,30.,40.,50.,60.,69 /)
res@tmXBLabels = (/ "10W","0","10E","20E","30E","40E","50E","60E","70E" /)
res@tmYLMode = "Explicit" ; Define own tick mark labels.
res@tmYLValues = (/ -39.,-30.,-20.,-10.,-0.,9 /)
res@tmYLLabels = (/"40S","30S","20S","10S","0","10N" /)
res@vpXF = 0.12 ; default is 0.2 change aspect
res@vpYF = 0.8 ; default is 0.8 ration
res@vpHeightF = 0.4 ; default is 0.6
res@vpWidthF = 0.8 ; default is 0.6
res@cnLevelSelectionMode = "ManualLevels" ; manual levels
res@cnMinLevelValF = 0 ; min level
res@cnMaxLevelValF = 400 ; max level
res@cnLevelSpacingF = 50 ; contour spacing
res@tmXBLabelFontHeightF = 0.02 ; resize tick labels
res@tmYLLabelFontHeightF = 0.02
res@pmLabelBarOrthogonalPosF = .10 ; move whole thing down
;************************************************
; plotting parameters
;************************************************
sres = True ; plot mods desired
sres@gsnMaximize = True ; maximize plot in frame
sres@xyMarkLineModes = (/"Markers","Lines"/) ; choose which have markers
sres@xyMarkers = 16 ; choose type of marker
sres@xyLineColors = (/"blue","black"/)
sres@xyMonoDashPattern = True
sres@gsLineDashPattern = 1
sres@xyDashPattern = 1 ; solid line
sres@xyLineThicknesses = (/1,4/) ; set second line to 2
sres@gsnDraw = False ; do not draw the plot
sres@gsnFrame = False
pr4@long_name = "model"
pr4@units = "s=-0.17 lat=-11.47"
; reverse the first two colors
setvalues wks
"wkColorMap" : "gsltod"
"wkForegroundColor" : (/0.,0.,0./)
"wkBackgroundColor" : (/1.,1.,1./)
end setvalues
;************************************************
; plotting parameters
;************************************************
cres = True ; plot mods desired
cres@gsnMaximize = True ; maximize plot in frame
cres@xyMarkLineModes = "Lines" ; choose which have markers
cres@xyDashPatterns = 0 ; solid line
cres@xyLineThicknesses = (/1,4/) ; set second line to 2
cres@gsnDraw = False ; do not draw the plot
cres@gsnFrame = False
; reverse the first two colors
setvalues wks
"wkColorMap" : "gsltod"
"wkForegroundColor" : (/0.,0.,0./)
"wkBackgroundColor" : (/1.,1.,1./)
end setvalues
print(rcMaxLon)
plot(gg) = gsn_csm_contour_map(wks,pr4({-40:10},{-10:70}),res) ; create plot
plot2 = gsn_csm_xy(wks,pr2&lon,data,sres) ; create plot
plot3 = gsn_csm_xy(wks,pr5&lon,datac,cres) ; create plot
overlay(plot(gg),plot2)
overlay(plot(gg),plot3)
;draw(plot(gg))
;frame(wks)
plot(gg) = gsn_csm_contour_map(wks,pr4({-40:10},{-10:70}),res)
delete(pr4)
end do
; panel resource list (if necessary)
panres = True ; mod panel plot
gsn_panel(wks,plot(:15),(/4,4/),panres) ; panel 16 models at a time.
gsn_panel(wks,plot(16:31),(/4,4/),panres)
gsn_panel(wks,plot(32:),(/4,4/),panres)
end
_______________________________________________
ncl-talk mailing list
List instructions, subscriber options, unsubscribe:
http://mailman.ucar.edu/mailman/listinfo/ncl-talk