Date: Wed May 07 2014 - 09:52:28 MDT
Hi All
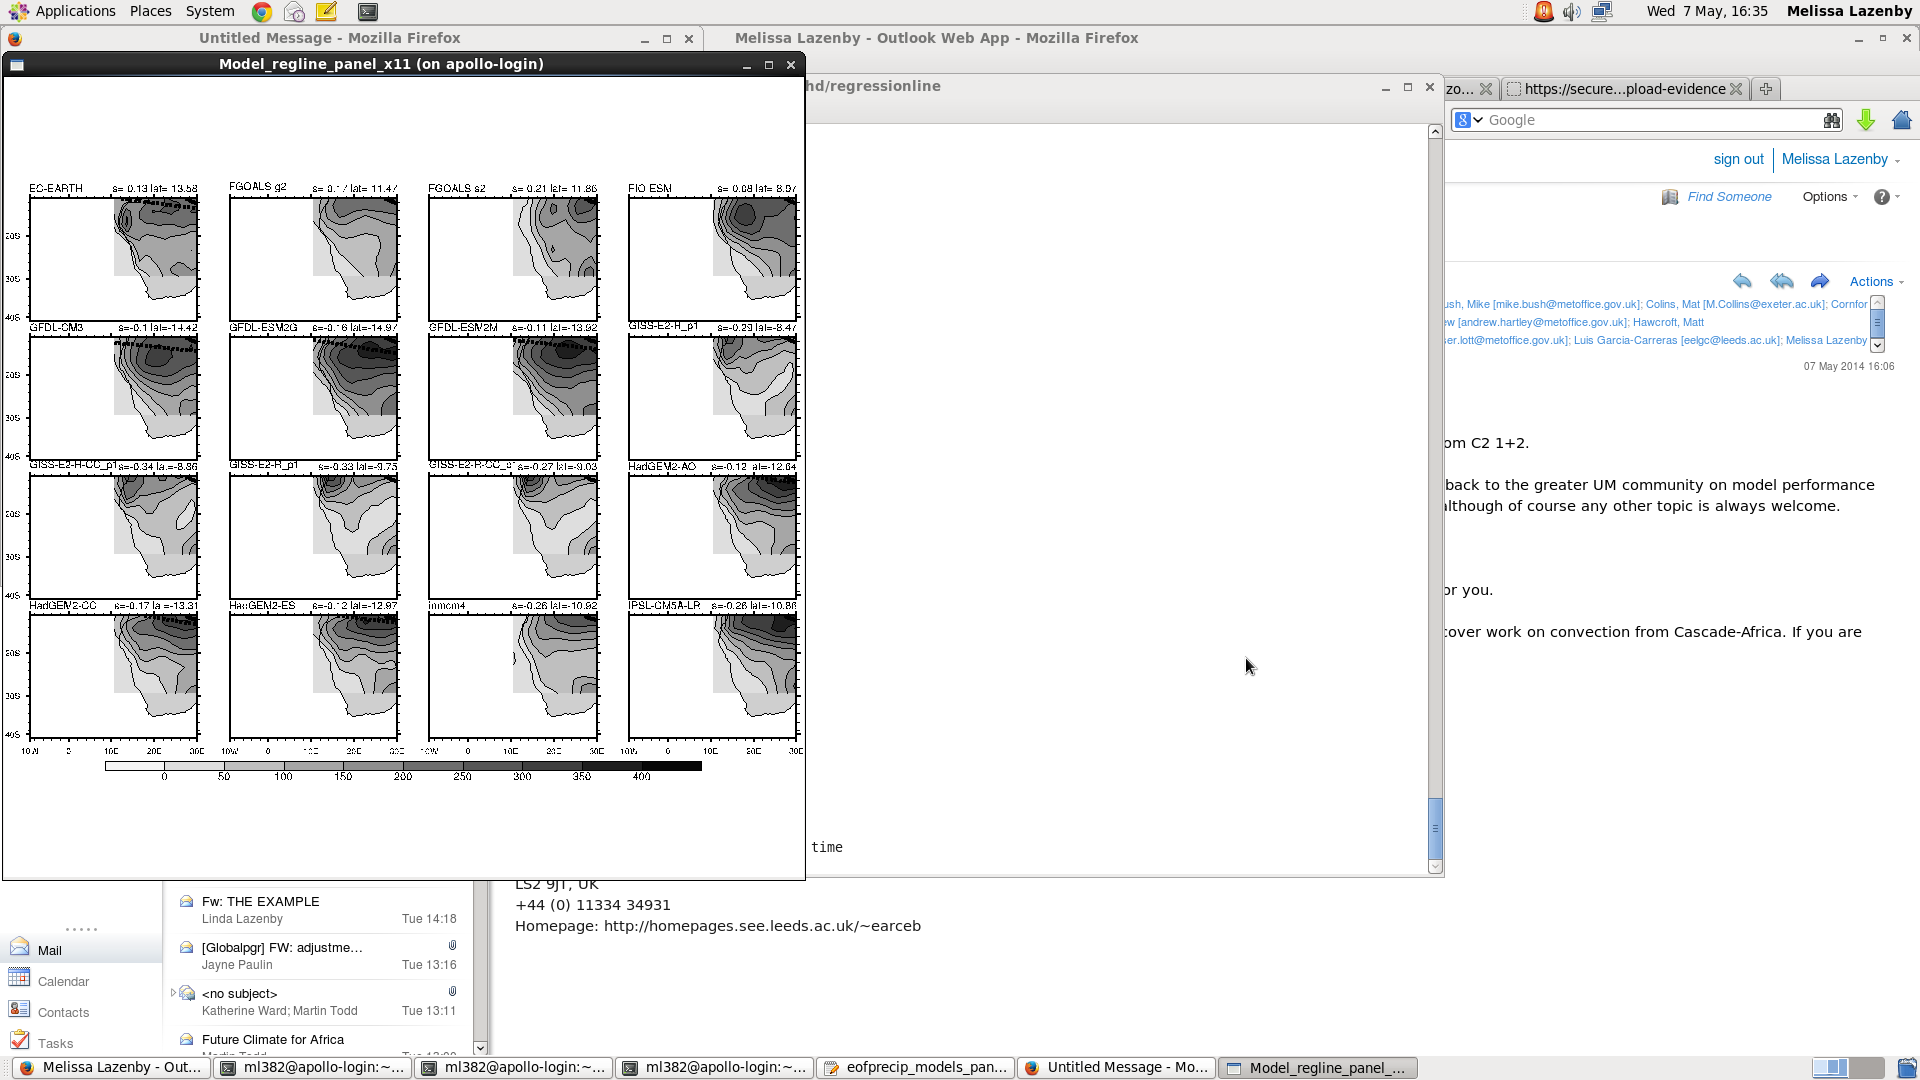
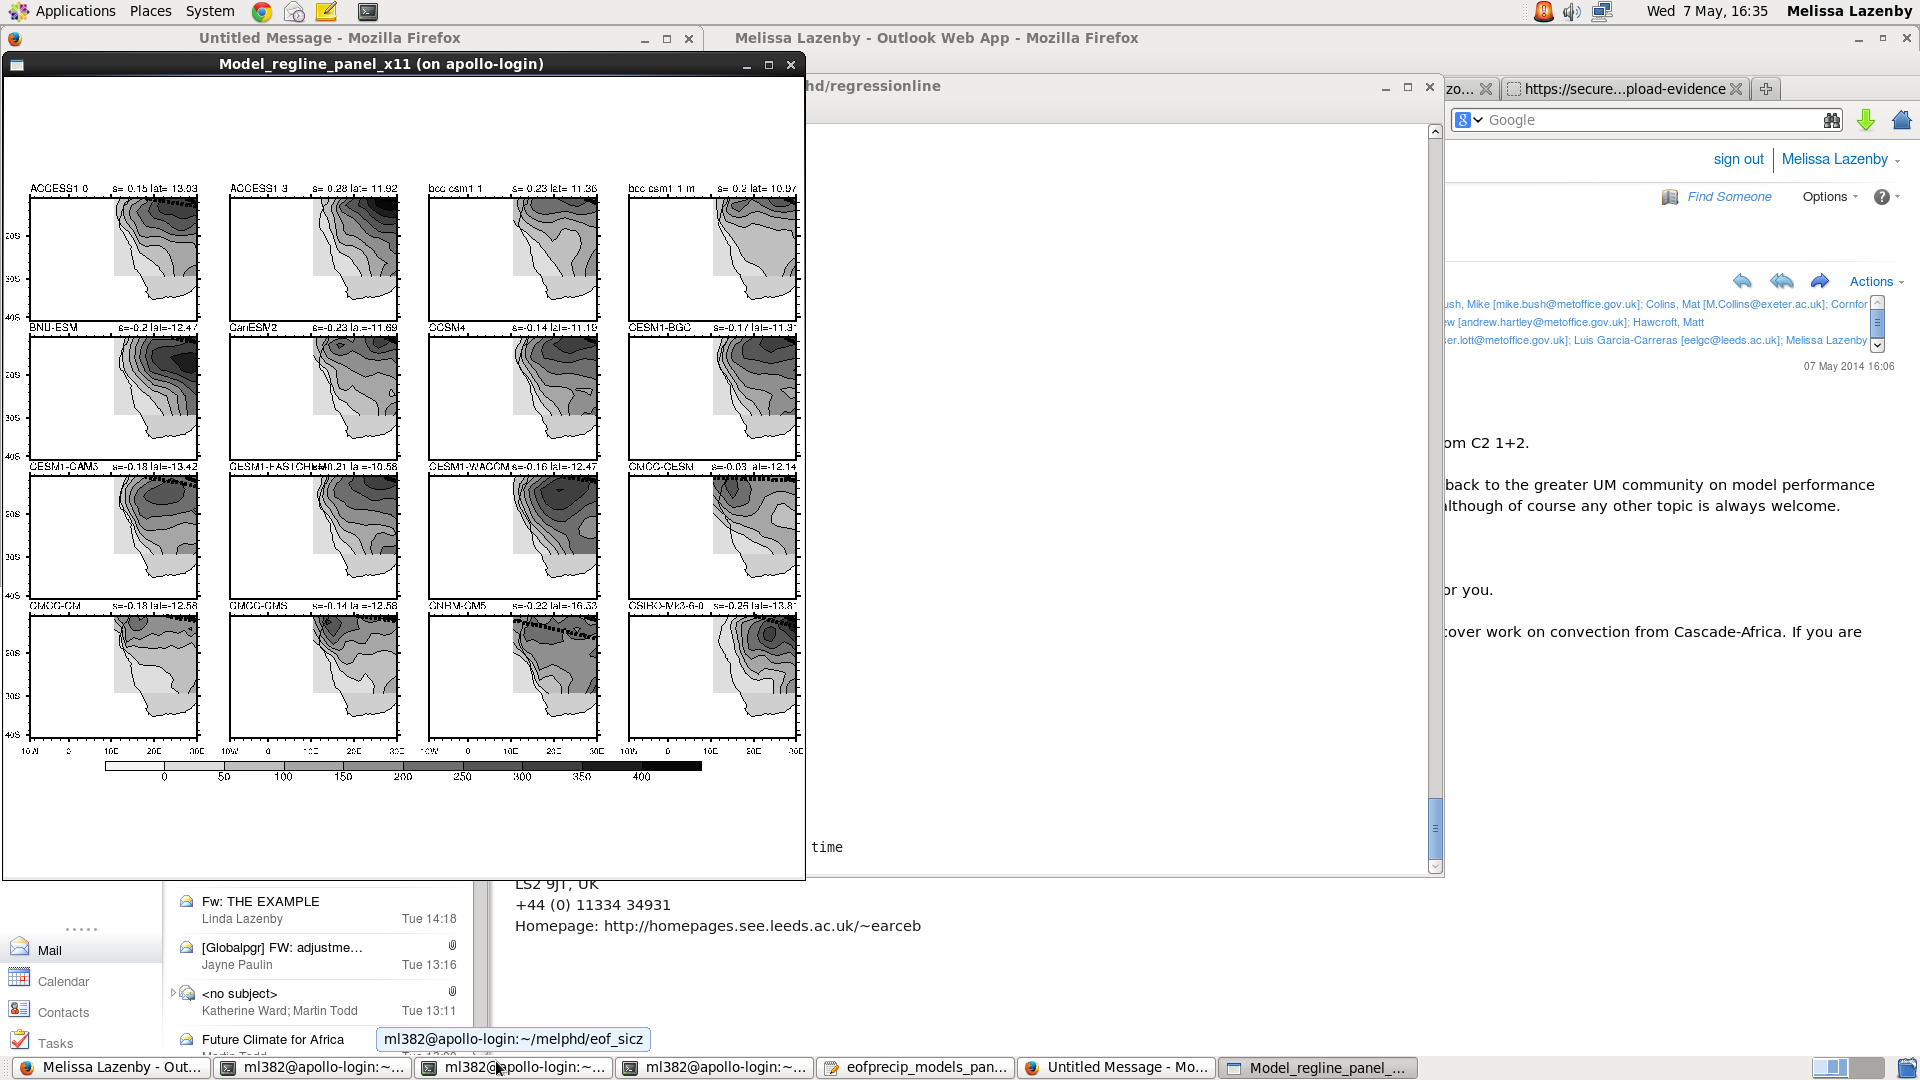
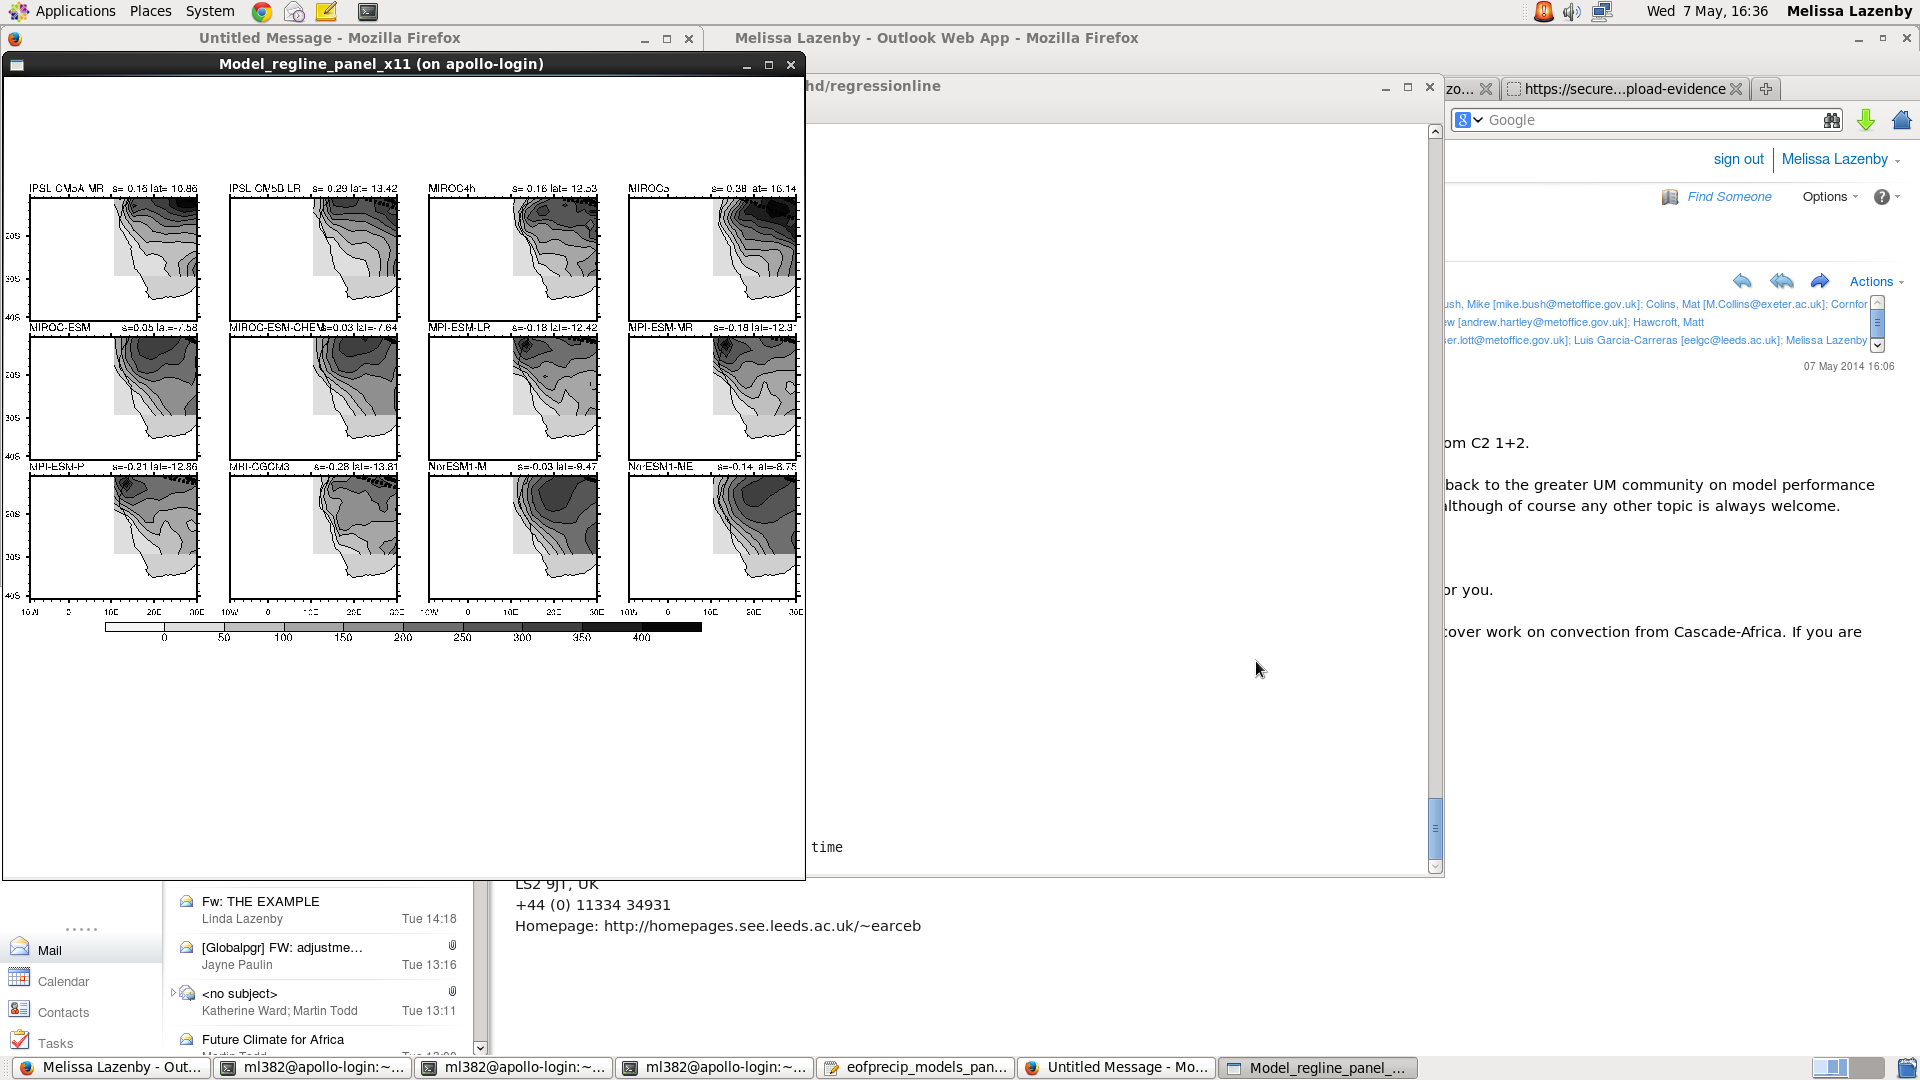
I am having a bit of trouble with the my panel plot. I am trying to display precip climatology for the region (lat:10N,40S lon: 10W,70E) and overlaid with 2 regression lines of max precip for the obs and model. Attached is the output and I am not sure why it is cutting off the domain like that. Below is my code, please let me know if you can see where I am doing something wrong.
Many thanks!
Kind Regards
Melissa
Code:
;*************************************************
; regline_panel plots.ncl
;
;*************************************************
load "$NCARG_ROOT/lib/ncarg/nclscripts/csm/gsn_code.ncl"
load "$NCARG_ROOT/lib/ncarg/nclscripts/csm/gsn_csm.ncl"
load "$NCARG_ROOT/lib/ncarg/nclscripts/csm/contributed.ncl"
begin
;************************************************
; Read in Precip Data.
;************************************************
;Models
model = (/"ACCESS1-0","ACCESS1-3","bcc-csm1-1","bcc-csm1-1-m","BNU-ESM","CanESM2","CCSM4","CESM1-BGC","CESM1-CAM5","CESM1-FASTCHEM","CESM1-WACCM","CMCC-CESM","CMCC-CM","CMCC-CMS","CNRM-CM5","CSIRO-Mk3-6-0","EC-EARTH","FGOALS-g2","FGOALS-s2","FIO-ESM","GFDL-CM3","GFDL-ESM2G","GFDL-ESM2M","GISS-E2-H_p1","GISS-E2-H-CC_p1","GISS-E2-R_p1","GISS-E2-R-CC_p1","HadGEM2-AO","HadGEM2-CC","HadGEM2-ES","inmcm4","IPSL-CM5A-LR","IPSL-CM5A-MR","IPSL-CM5B-LR","MIROC4h","MIROC5","MIROC-ESM","MIROC-ESM-CHEM","MPI-ESM-LR","MPI-ESM-MR","MPI-ESM-P","MRI-CGCM3","NorESM1-M","NorESM1-ME"/)
wks = gsn_open_wks("X11","Model_regline_panel") ; specifies a plot
gsn_define_colormap(wks,"gsltod") ; choose color map
plot = new (dimsizes(model),"graphic")
do gg = 0,dimsizes(model)-1
in=addfile("/mnt/geog/ml382/melphd/regressionline/siczoutputprregline99/pr_Amon_"+model(gg)+"_historical_safrica_climDJF1.nc","r")
lat = in->lat ; get lat
lon = in->lon ; get lon
time = in->time ; get time
if ((gg.eq.17) .or. (gg.eq.21) .or. (gg.eq.22)) then
pr1 = in->pr(:,:,:)
else
pr1 = in->pr(:,0,:,:)
end if
; read in model data
pr2 = pr1(time|0, {lat|-30:0}, {lon|10:50})
dimpr2 = dimsizes(pr2)
nlat = dimpr2(0)
mlon = dimpr2(1)
pr2MaxLon = new ( mlon, typeof(pr2), pr2@_FillValue)
do ml=0,mlon-1
imax = maxind(pr2(:,ml))
pr2MaxLon(ml) = dble2flt(lat(imax))
end do
print(pr2MaxLon)
print(pr2&lon)
print("-------------------------------")
print("pr2MaxLon: "+pr2&lon+" "+pr2MaxLon)
;Regression Line
rcMaxLon = regline(pr2&lon,pr2MaxLon)
print(rcMaxLon)
print(rcMaxLon@yave)
bMaxLon = rcMaxLon@yintercept
print(bMaxLon)
xMaxLon = pr2&lon
print(xMaxLon)
yMaxLon = rcMaxLon*pr2&lon + bMaxLon
print(yMaxLon)
print("-------------------------------")
print(xMaxLon+" "+yMaxLon)
;************************************************
; create an array to hold both the original data
; and the calculated regression line
;************************************************
data = new ( (/2,dimsizes(pr2MaxLon)/), typeof(pr2MaxLon))
data(1,:) = dble2flt(rcMaxLon)*(dble2flt(xMaxLon)-dble2flt(rcMaxLon@xave)) + dble2flt(rcMaxLon@yave)
;************************************************
; Read in Precip Data with larger domain.
;************************************************
f=addfile("/mnt/geog/ml382/melphd/regressionline/siczoutputprregline2/pr_Amon_"+model(gg)+"_historical_safrica_climDJF1.nc","r")
lat1 = f->lat ; get lat
lon1 = f->lon ; get lon
time1 = f->time
if ((gg.eq.17) .or. (gg.eq.21) .or. (gg.eq.22)) then
pr6 = in->pr(:,:,:)
else
pr6 = in->pr(:,0,:,:)
end if
pr4 = pr6(time|0,{lat|-40:10}, {lon|-10:70})
;************************************************
; Read in Precip Data.
;************************************************
;Obs
cin = addfile("/mnt/nfs2/geog/ml382/melphd/regressionline/cmap61.nc","r")
prcmap = cin->precip(:,:,:)
pr5 = prcmap(time|0, {lat|-30:0}, {lon|10:50})
;fili = "/mnt/nfs2/geog/ml382/melphd/regressionline/cmap61.nc" ; data
;f = addfile (fili , "r") ; add file
;lat = cin->lat ; get lat
;lon = cin->lon ; get lon
;time = cin->time ; get time
;level = f->z ; get level
;pr6 = f->precip ; get precip
;printVarSummary(pr6)
;*************************************************************
;Calculations of max precip for lat and lon values
;**************************************************************
dimpr5 = dimsizes(pr5)
nlat = dimpr5(0)
mlon = dimpr5(1)
pr5MaxLon = new ( mlon, typeof(pr5), pr5@_FillValue)
do ml=0,mlon-1
imax = maxind(pr5(:,ml))
pr5MaxLon(ml) = dble2flt(lat(imax))
end do
print(pr5MaxLon)
print(pr5&lon)
print("-------------------------------")
print("pr5MaxLon: "+pr5&lon+" "+pr5MaxLon)
;Regression Line
regcMaxLon = regline(pr5&lon,pr5MaxLon)
print(regcMaxLon)
print(regcMaxLon@yave)
bMaxLon = regcMaxLon@yintercept
print(bMaxLon)
xMaxLon = pr5&lon
print(xMaxLon)
yMaxLon = regcMaxLon*pr5&lon + bMaxLon
print(yMaxLon)
print("-------------------------------")
print(xMaxLon+" "+yMaxLon)
;************************************************
; create an array to hold both the original data
; and the calculated regression line
;************************************************
datac = new ( (/2,dimsizes(pr5MaxLon)/), typeof(pr5MaxLon))
datac(1,:) = dble2flt(regcMaxLon)*(dble2flt(xMaxLon)-dble2flt(regcMaxLon@xave)) + dble2flt(regcMaxLon@yave)
; resource lists
res = True ; plot mods desired
res@gsnAddCyclic = False
res@cnFillOn = True ; color on
res@lbLabelStride = 2 ; every other label
res@gsnSpreadColors = True ; use full range of color map
res@cnLineLabelsOn = False ; no contour line labels
res@lbLabelBarOn = False
res@gsnDraw = False ; do not draw the plot
res@gsnFrame = False
;pr4 = pr6(0,{-40:10},{-10:70})
dimpr4 = dimsizes(pr4)
latn = dimpr4(0)
lonm = dimpr4(1)
res@mpLimitMode = "Corners" ;
res@mpLeftCornerLonF = lon1(0)
res@mpRightCornerLonF = lon1(lonm-1)
res@mpLeftCornerLatF = lat1(0)
res@mpRightCornerLatF = lat1(latn-1)
res@tmXBMode = "Explicit" ; Define own tick mark labels.
res@tmXBValues = (/ -9.,0.,10.,20.,30.,40.,50.,60.,69 /)
res@tmXBLabels = (/ "10W","0","10E","20E","30E","40E","50E","60E","70E" /)
res@tmYLMode = "Explicit" ; Define own tick mark labels.
res@tmYLValues = (/ -39.,-30.,-20.,-10.,-0.,9 /)
res@tmYLLabels = (/"40S","30S","20S","10S","0","10N" /)
res@vpXF = 0.12 ; default is 0.2 change aspect
res@vpYF = 0.8 ; default is 0.8 ration
res@vpHeightF = 0.4 ; default is 0.6
res@vpWidthF = 0.8 ; default is 0.6
res@cnLevelSelectionMode = "ManualLevels" ; manual levels
res@cnMinLevelValF = 0 ; min level
res@cnMaxLevelValF = 400 ; max level
res@cnLevelSpacingF = 50 ; contour spacing
res@tmXBLabelFontHeightF = 0.02 ; resize tick labels
res@tmYLLabelFontHeightF = 0.02
res@pmLabelBarOrthogonalPosF = .10 ; move whole thing down
;************************************************
; plotting parameters
;************************************************
sres = True ; plot mods desired
sres@gsnMaximize = True ; maximize plot in frame
sres@xyMarkLineModes = (/"Markers","Lines"/) ; choose which have markers
sres@xyMarkers = 16 ; choose type of marker
sres@xyLineColors = (/"blue","black"/)
sres@xyMonoDashPattern = True
sres@gsLineDashPattern = 1
sres@xyDashPattern = 1 ; solid line
sres@xyLineThicknesses = (/1,4/) ; set second line to 2
sres@gsnDraw = False ; do not draw the plot
sres@gsnFrame = False
Round = decimalPlaces(rcMaxLon,2,True)
Round1 = decimalPlaces(rcMaxLon@yave,2,True)
pr4@long_name = ""+model(gg)+""
;pr4@units = "s="+rcMaxLon+" lat="+rcMaxLon@yave+""
pr4@units = "s="+Round+" lat="+Round1+""
; reverse the first two colors
setvalues wks
"wkColorMap" : "gsltod"
"wkForegroundColor" : (/0.,0.,0./)
"wkBackgroundColor" : (/1.,1.,1./)
end setvalues
;************************************************
; plotting parameters
;************************************************
cres = True ; plot mods desired
cres@gsnMaximize = True ; maximize plot in frame
cres@xyMarkLineModes = "Lines" ; choose which have markers
cres@xyDashPatterns = 0 ; solid line
cres@xyLineThicknesses = (/1,4/) ; set second line to 2
cres@gsnDraw = False ; do not draw the plot
cres@gsnFrame = False
; reverse the first two colors
setvalues wks
"wkColorMap" : "gsltod"
"wkForegroundColor" : (/0.,0.,0./)
"wkBackgroundColor" : (/1.,1.,1./)
end setvalues
print(rcMaxLon)
res@tmXBLabelsOn = False ; do not draw bottom labels
res@tmXBOn = False ; no bottom tickmarks
res@tmYLLabelsOn = False ; no right labels
res@tmYLOn = False ; no right tickmarks
if((gg.eq.12) .or. (gg.eq.13) .or. (gg.eq.14) .or. (gg.eq.15) .or. (gg.eq.28) .or. (gg.eq.29) .or.(gg.eq.30) .or. (gg.eq.31) .or. (gg.eq.40) .or. (gg.eq.41) .or. (gg.eq.42) .or. (gg.eq.43)) then
res@tmXBLabelsOn = True ; do not draw bottom labels
res@tmXBOn = True ; no bottom tickmarks
else
res@tmXBLabelsOn = False ; do not draw bottom labels
res@tmXBOn = False ; no bottom tickmarks
end if
if((gg.eq.0) .or. (gg.eq.4) .or. (gg.eq.8) .or. (gg.eq.12) .or. (gg.eq.16) .or. (gg.eq.20) .or.(gg.eq.24) .or. (gg.eq.28) .or. (gg.eq.32) .or. (gg.eq.36) .or. (gg.eq.40)) then
res@tmYLLabelsOn = True ; do not draw bottom labels
res@tmYLOn = True ; no bottom tickmarks
else
res@tmYLLabelsOn = False ; do not draw bottom labels
res@tmYLOn = False ; no bottom tickmarks
end if
plot(gg) = gsn_csm_contour_map(wks,pr4({-40:10},{-10:70}),res) ; create plot
plot2 = gsn_csm_xy(wks,pr2&lon,data,sres) ; create plot
plot3 = gsn_csm_xy(wks,pr5&lon,datac,cres) ; create plot
overlay(plot(gg),plot2)
overlay(plot(gg),plot3)
delete(pr4)
end do
; panel resource list (if necessary)
panres = True ; mod panel plot
panres@gsnPanelLabelBar = True ; add common colorbar
panres@lbLabelFontHeightF =.010 ; make labels larger
panres@gsnMaximize = True ; Maximize plot in frame.
gsn_panel(wks,plot(:15),(/4,4/),panres) ; panel 16 models at a time.
gsn_panel(wks,plot(16:31),(/4,4/),panres)
gsn_panel(wks,plot(32:),(/4,4/),panres)
end
_______________________________________________
ncl-talk mailing list
List instructions, subscriber options, unsubscribe:
http://mailman.ucar.edu/mailman/listinfo/ncl-talk