Date: Thu May 22 2014 - 16:12:09 MDT
Hi Mary,
I was trying to regrid data on 0.1deg x 0.1deg to a 12km x 12 km WRF domain
using the function of "rcm2rgrid." The description of this function looks
good match for this purpose. But after interpolation, the output doesn't
look good to use (assuming nothing wrong in interpolation). After ncdump
the variable, it shows a lot of
---- _, _, _, _, _, _, _, _, _, _, _, _, _, _, _, _, _, _, _, _, _, _, _,
_,
_, _, _, _, _, _, _, _, _, _, _, _, _, _, _, _, _, _, _, _, _, _, _, _,
_, _, _, _, _, _, _, _, _, _, _, _, _, _, _, _, _, _, _, _, _, _, _, _,
_, _, _, _, _, _, _, _, _, _, _, _, _, _, _, _, _, _, _, _, _, _, _, _,
_, _, _, _, _, _, _, _, _, _, _, _, _, _, _, _, _, _, _, _, _, _, _, _,
_, _, _, _, _, _, _, _, _, _, _, _, _, _, _, _, _, _, _, _, _, _, _, _,
_, _, _, _, _, _, _, _, _, _, _,
_, _, _, _, _, _, _, _, _, _, _, _, _, _, _, _,
---
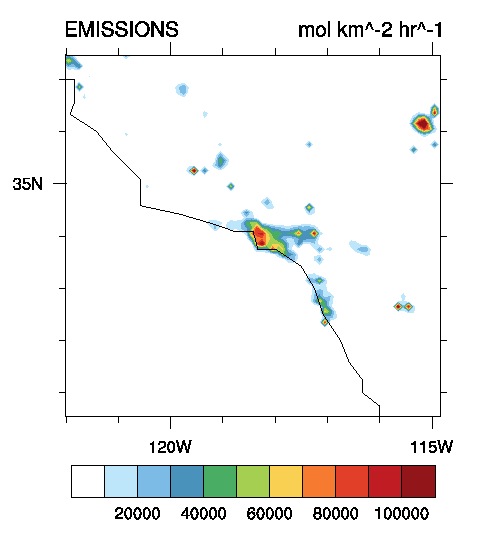
and ncview can't even run through. I attached my ncl codes as follows, and
a plot for the source data that is carbon emission (I guess, rcm2rgrid
might not be a good option for such scattering data). Could you take a look
and help me for interpolation?
....
f = addfile(dir+fname,"r")
  xin = f->E_Carbon
  latin = f->lat
  lonin = f->lon
  printMinMax(lonin,True)
  printMinMax(xin,True)
  a = addfile(dir+"wrfout_d"+dm+".nc","r")
  lat = wrf_user_getvar(a,"lat",0)
  lon = wrf_user_getvar(a,"lon",0)
  printMinMax(lon,True)
  data = rgrid2rcm_Wrap(latin,lonin,xin,lat,lon,0)
  printVarSummary(data)
  printMinMax(data,True)
.....
Many thanks!
Sha
_______________________________________________
ncl-talk mailing list
List instructions, subscriber options, unsubscribe:
http://mailman.ucar.edu/mailman/listinfo/ncl-talk
