Date: Wed May 28 2014 - 14:53:17 MDT
Hello,
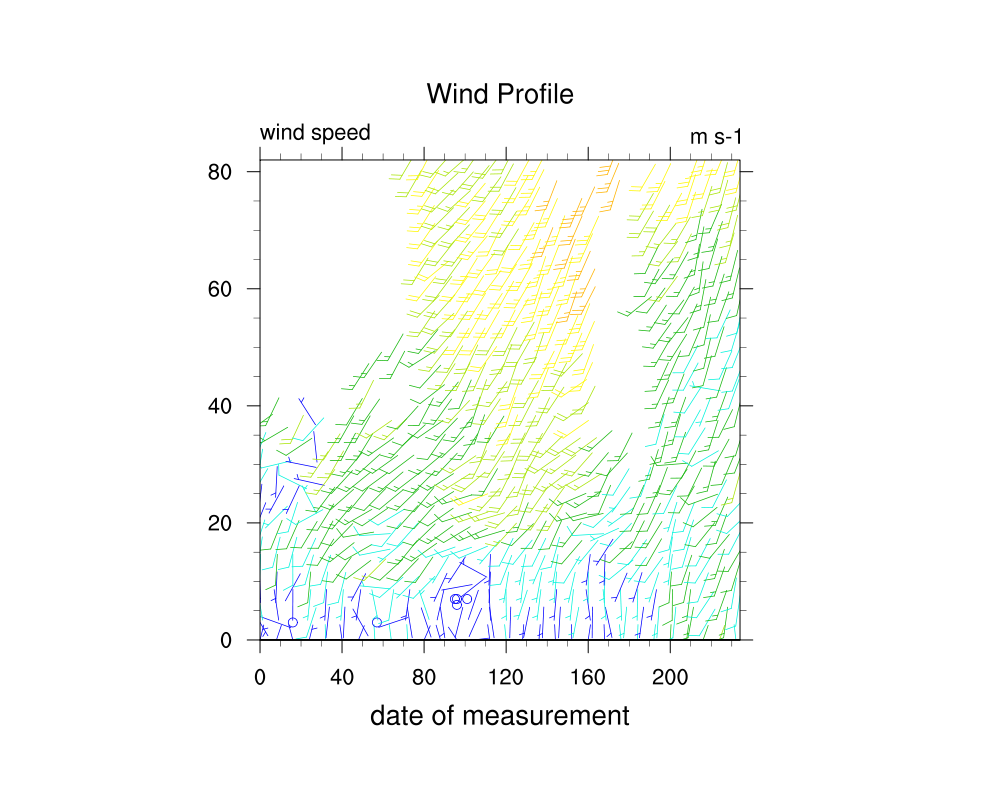
I've plotted my data using barb_4.ncl as an example. The data did not
originally have the height attribute attached (and of course gave
warnings with time axis being seconds_since.....), so the barbs were
plotted with the x and y axis ticks being bin numbers (1st image).
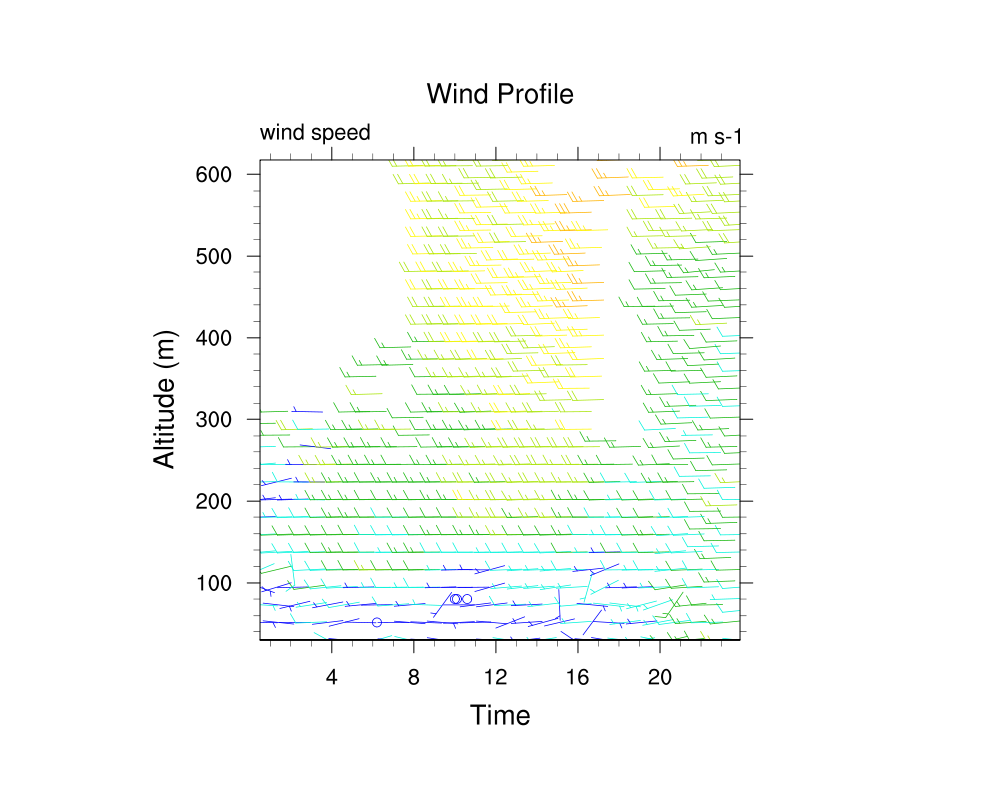
I attached the height coordinate variable and converted the time to
create the proper x and y axis (2nd image), however the barb direction
is definitely incorrect. It appears the barb direction is dependent on
the scaling of x and y ticks, which makes me wonder if the 1st plot was
correct since the scaling was different there as well.
What is the best way to create this plot so the barb directions are
accurate and I have nice axis ticks/labels? Can send data if needed.
Thanks much!
Tracy
load "/usr/share/ncarg/nclscripts/csm/gsn_code.ncl"
load "/usr/share/ncarg/nclscripts/csm/gsn_csm.ncl"
load "/usr/share/ncarg/nclscripts/csm/contributed.ncl"
begin
f = addfile("/scr/sci/temerson/data/cops/profiler/cops_supv_mfuhfw_wprohi_d_01.nc","r")
time = f->time
time1 = cd_calendar(time,0)
time2 = time1(:,3)+(time1(:,4)+time1(:,5)/60.)/60.
hgt = f->height(0,:)
print(flt2string(time1(0,0)))
wspd = f->wind_speed
wspd@_FillValue = wspd@fill_value
wspd!1 = "uhf_gate"
wspd&uhf_gate = hgt
wspd&time = time2
wdir = f->wind_from_direction
wdir@_FillValue = wdir@fill_value
wdir!1 = "uhf_gate"
wdir&uhf_gate = hgt
wdir&time = time2
rad = 4.0*atan(1.0)/180.
u = wspd
v = wspd
u = -wspd*sin(rad*wdir)
v = -wspd*cos(rad*wdir)
wks = gsn_open_wks("x11","20070701_wind_profiler5")
gsn_define_colormap(wks,"BlAqGrYeOrReVi200")
res = True
res@tiMainString = flt2string(time1(0,1)) + "/" + flt2string(time1(0,2)) + "/" + flt2string(time1(0,0))
res@tiYAxisString = "Altitude (m)"
res@tiXAxisString = "Time (UTC)"
res@vcGlyphStyle = "WindBarb"
res@vcRefLengthF = 0.045
res@vcRefAnnoOn = False
res@lbLabelBarOn = False
res@vcWindBarbLineThicknessF = 1.5
res@vcMonoWindBarbColor = False
res@vcLevelSelectionMode = "ExplicitLevels"
res@vcLevels = ispan(5,30,5)
res@vcLevelColors = (/2,40,70,90,105,130,175/)
res@vcMinDistanceF = .02
plot = gsn_csm_vector_scalar(wks,u(uhf_gate|:,time|:),v(uhf_gate|:,time|:),wspd(uhf_gate|:,time|:),res)
end
_______________________________________________
ncl-talk mailing list
List instructions, subscriber options, unsubscribe:
http://mailman.ucar.edu/mailman/listinfo/ncl-talk