Date: Tue May 27 2014 - 23:26:10 MDT
Hello,
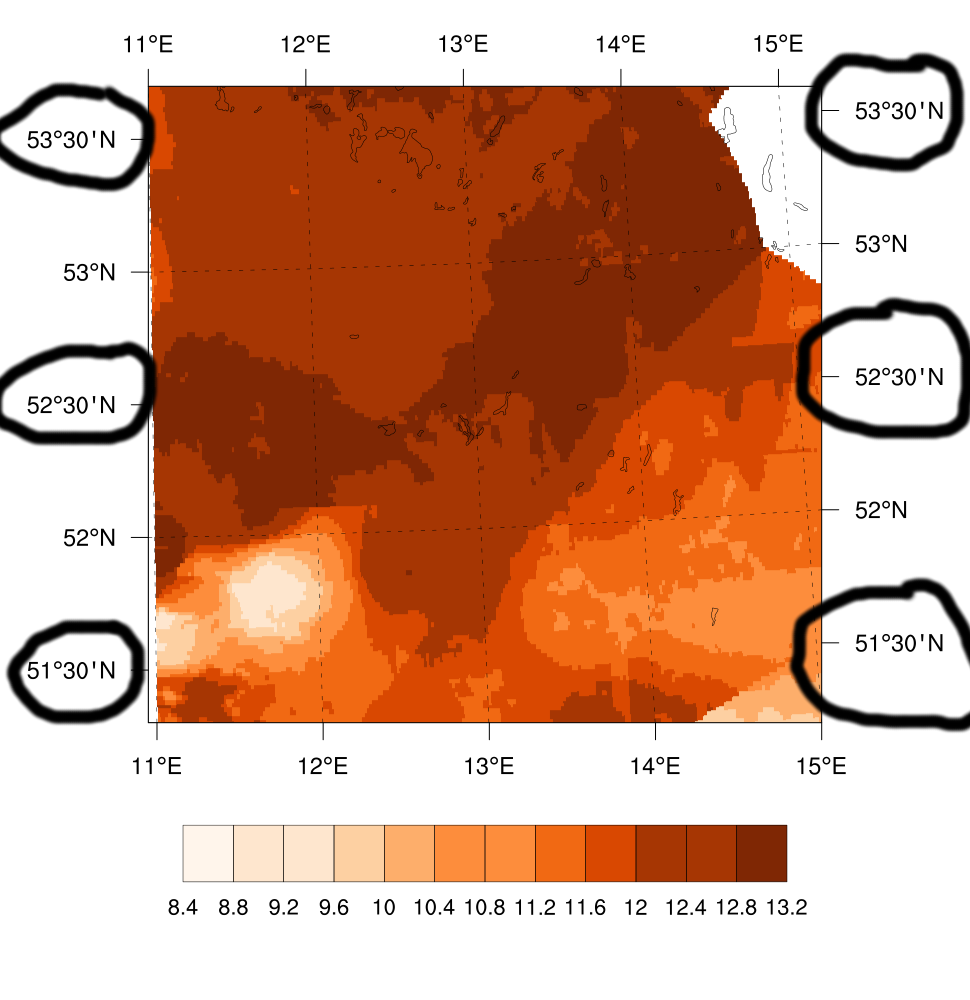
i have a map in stereographic projection (see attached png.file). The
system is automatically adding a setting for major and minor lat/lon
labels.
Using the lines:
res@gsnMajorLatSpacing = 1
res@gsnMinorLatSpacing = 1
res@gsnMajorLonSpacing = 1
res@gsnMinorLonSpacing = 1
i try to change the default setting. Unfortunately i get the following
warnings and nothing happens.
warning:gsnMajorLatSpacing is not a valid resource in map at this time
warning:gsnMajorLonSpacing is not a valid resource in map at this time
warning:gsnMinorLatSpacing is not a valid resource in map at this time
warning:gsnMinorLonSpacing is not a valid resource in map at this time
warning:gsnMajorLatSpacing is not a valid resource in
temp-develop_contour at this time
warning:gsnMajorLonSpacing is not a valid resource in
temp-develop_contour at this time
warning:gsnMinorLatSpacing is not a valid resource in
temp-develop_contour at this time
warning:gsnMinorLonSpacing is not a valid resource in
temp-develop_contour at this time
What can i do to manually define the lat/lon label spacing? I want to
have only full degree labels 52 and 53°N.
Thanks in advance
Frank
--
++++++++++++++++++++++++++++++++++++++++++++
Dr. Frank Kreienkamp
Deutscher Wetterdienst (DWD)
Abteilung Klima- und Umweltberatung
Sachgebiet Klimaprojektionen und Klimavorhersagen
Michendorfer Chaussee 23
14473 Potsdam
Tel.: ++49(0)331-316-346
E-Mail: frank.kreienkamp@dwd.de
++++++++++++++++++++++++++++++++++++++++++++
;*************************************************
; NCL Graphics: polar_1.ncl
;
;************************************************
load "$NCARG_ROOT/lib/ncarg/nclscripts/csm/gsn_code.ncl"
load "$NCARG_ROOT/lib/ncarg/nclscripts/csm/gsn_csm.ncl"
load "$NCARG_ROOT/lib/ncarg/nclscripts/csm/contributed.ncl"
load "$NCARG_ROOT/lib/ncarg/nclscripts/csm/shea_util.ncl"
;************************************************
begin
;************************************************
; read in netCDF file
;************************************************
a = addfile("temp-develop.nc","r")
u = a->field(:,:)
u@lat2d = a->lat(:,:) ; add 2d coordinate data
u@lon2d = a->lon(:,:) ; add 2d coordinate data
;************************************************
; create plot
;************************************************
wtype = "png"
wtype@wkWidth = 970 ; Set the pixel size of PNG image.
wtype@wkHeight = 1000
wks = gsn_open_wks(wtype,"temp-develop")
res = True
res@gsnMaximize = True
res@gsnDraw = False
res@gsnFrame = False
res@mpProjection = "Stereographic"
res@mpCenterLatF = 50 ; Centered over Germany
res@mpCenterLonF = 10 ; Centered over Germany
res@mpLimitMode = "Corners" ; choose range of map
res@mpLeftCornerLatF = 53.7
res@mpLeftCornerLonF = 11.0
res@mpRightCornerLatF = 51.2
res@mpRightCornerLonF = 15.0
res@mpGridLatSpacingF = 1
res@mpGridLonSpacingF = 1
;res@gsnMajorLatSpacing = 1 ; change maj lat tm spacing
;res@gsnMajorLonSpacing = 1 ; change maj lon tm spacing
res@mpOutlineDrawOrder = "PostDraw" ; draw continental outline last
res@mpFillDrawOrder = "PreDraw"
res@mpDataBaseVersion = "HighRes" ; use finer database
res@mpOutlineBoundarySets = "National"
res@mpFillOn = False ; turns off continent gray
res@mpLeftAngleF = 7
res@mpRightAngleF = 8
res@mpBottomAngleF = 6
res@mpTopAngleF = 8
res@mpMinLatF = 10.0
res@pmTickMarkDisplayMode = "Always" ; Nicer tickmark labels
res@mpGridAndLimbOn = True ; Turn on lat/lon grid
res@mpGridLineDashPattern = 2 ; Dashed lines
res@gsnLeftString = ""
res@gsnMajorLatSpacing = 1
res@gsnMinorLatSpacing = 1
res@gsnMajorLonSpacing = 1
res@gsnMinorLonSpacing = 1
;---Plot will just be created, and not drawn yet.
plot = gsn_csm_map(wks,res) ; Create plot
cmap = RGBtoCmap("/kp/kp05/fkreienk/data/VisTool/data/konstdat/Farben_rgb_temp.dat")
gsn_define_colormap(wks,cmap)
;---adding map
res@cnFillOn = True ; color Fill
res@cnFillMode = "RasterFill" ; Raster Mode
res@cnLinesOn = False ; Turn off contour lines
res@cnLevelSelectionMode = "AutomaticLevels"
res@cnLabelBarEndStyle = "ExcludeOuterBoxes"
res@gsnAddCyclic = False ; regional data: not cyclic
;---Plot will just be created, and not drawn yet.
plot = gsn_csm_contour_map(wks,u,res)
;---Drawing the plot
draw(plot)
frame(wks)
end
_______________________________________________
ncl-talk mailing list
List instructions, subscriber options, unsubscribe:
http://mailman.ucar.edu/mailman/listinfo/ncl-talk