Date: Wed Jun 04 2014 - 00:27:16 MDT
Hi Mary, ncl-talk,
I think now I know where the problem comes from but I still don't know how
to fix it. I think I don't get the right storm density due to the wrong
overlaying in the Arctic.
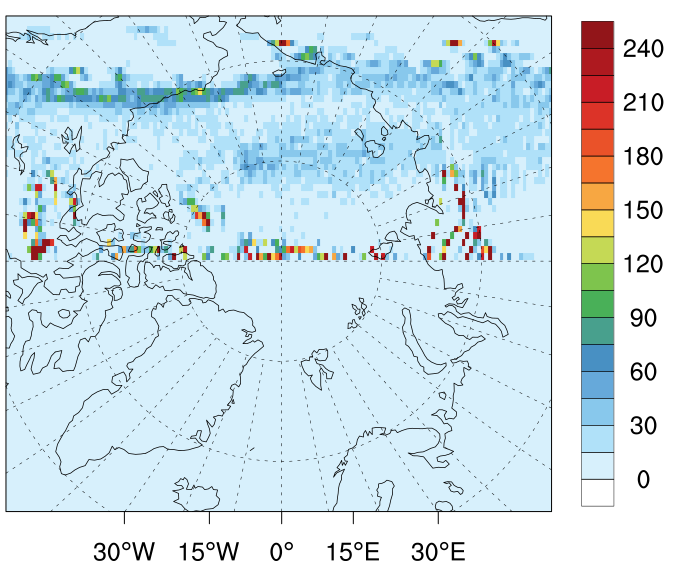
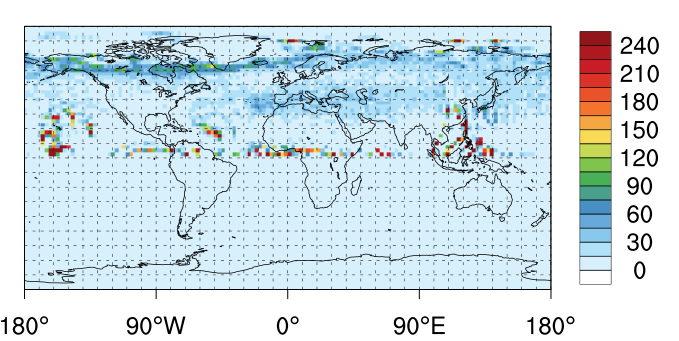
When I plot the density over the globe, I get the right density (see the
plot1_globe). However over the Arctic ncl takes the density all over the
globe and just overlaps it on the Arctic without plotting only Arctic
storms (plot2_arctic), which is what I need.
Do you have a suggestion of how to fix that? Thank you
load "$NCARG_ROOT/lib/ncarg/nclscripts/csm/gsn_code.ncl"
load "$NCARG_ROOT/lib/ncarg/nclscripts/csm/gsn_csm.ncl"
load "$NCARG_ROOT/lib/ncarg/nclscripts/csm/contributed.ncl"
load "$NCARG_ROOT/lib/ncarg/nclscripts/csm/shea_util.ncl"
begin
dummy1 =
asciiread("/import/c/w/asemenov/cyclone_codes/Finding/SLP_gra/NCEP_sum",-1,"float")
ncol1 = 6
npts1 = dimsizes(dummy1)/ncol1
data1 = onedtond(dummy1,(/npts1,ncol1/)) ; npts x ncol
data1@_FillValue = -9999999
lon1 = data1(:,0)
lat1 = data1(:,1)
slp1 = data1(:,5)
hz10 = data1(:,3)
hz11 = data1(:,4)
hz21 = data1(:,2)
arr1 = new((/73,144/),integer,-999)
arr1!0 = "lat1"
; arr1&lat1=fspan(2.5,87.5,34)
arr1&lat1=fspan(-90,90,73)
arr1&lat1@units = "degrees_north"
arr1!1 = "lon1"
arr1&lon1=fspan(0,357.5,144)
arr1&lon1@units = "degrees_east"
printVarSummary(arr1)
arr1 = 0 ; set array to all 0's
do nn = 0,dimsizes(slp1)-1
if (.not.ismissing(lat1(nn)).and..not.ismissing(lon1(nn))) then ;
check to make sure lat/lons are present
arr1({lat1(nn)},{lon1(nn)}) = (/ arr1({lat1(nn)},{lon1(nn)})+1 /)
end if
end do
printVarSummary(slp1)
printVarSummary(arr1)
printMinMax(arr1, True)
wks = gsn_open_wks("x11","density_")
gsn_define_colormap(wks,"WhiteBlueGreenYellowRed") ; not technically
necessary
res = True
res@cnFillOn = True
res@cnLinesOn = False
res@cnLineLabelsOn = False
res@gsnSpreadColors = True
res@gsnLeftString = " "
res@gsnRightString = " "
res@gsnDraw = False
res@gsnFrame = False
res@gsnMaximize = True
res@tiMainOn = False
res@tiMainPosition = "Center"
res@tiMainFontHeightF = 0.025
res@tfDoNDCOverlay =True
res@gsnAddCyclic = False
; res@mpLimitMode = "Corners"
; res@mpLeftCornerLatF = 53.5
; res@mpLeftCornerLonF = -44.7
; res@mpRightCornerLatF = 54.2
; res@mpRightCornerLonF = 135.1
; res@mpCenterLonF = 0
; res@mpCenterLatF = 90
; res@mpProjection = "CylindricalEquidistant"
res@mpLimitMode = "Corners"
res@mpLeftCornerLatF = -90
res@mpLeftCornerLonF = -180
res@mpRightCornerLatF = 90
res@mpRightCornerLonF = 180
res@mpCenterLonF = 0
res@mpCenterLatF = 0
res@mpProjection = "CylindricalEquidistant"
res@cnFillMode = "RasterFill" ; fill each grid box
res@cnLevelSelectionMode = "ExplicitLevels"
res@cnLevels = ispan(0,250,15)
map = gsn_csm_contour_map(wks,arr1(:,:),res)
draw(map)
frame(wks)
end
2014-06-04 2:03 GMT+04:00 Mary Haley <haley@ucar.edu>:
> Dear Igor,
>
> It is difficult to look at a script and determine what might be going
> wrong with the plot without the data file. Are you getting any warnings or
> errors at all?
>
> It looks to me like either you do not have valid data in certain regions
> of the map, or else your do loop below is incorrect.
>
> One thing that is not correct is this, but NCL might have just ignored it:
>
> > res@sfXArray = lon1
> > res@sfYArray = lat1
>
> You already attached coordinate arrays to "arr1", so you shouldn't be
> setting the above to lines. Remove or comment them out.
>
> You might try plotting the slp1 data at the lat1/lon1 locations just to
> make sure this looks okay. When plotting slp1, you *do* want to set:
>
> > res@sfXArray = lon1
> > res@sfYArray = lat1
>
>
>
> --Mary
>
>
> On Jun 2, 2014, at 2:15 AM, igor akkerman <igorakkerman89@gmail.com>
> wrote:
>
> > Hi ncl,
> >
> > I have a problem with plotting a density of storms over the Arctic. The
> distribution of density looks messy and lacks consistent coverage, which I
> failed fixing. Could you please take a look and tell me if there is a way
> to make the plotting work?
> >
> > Thanks
> >
> > Min Max values
> > Lon
> > min=0 max=357.5
> > Lat
> > min=2.5 max=87.5
> > SLP:
> > min=931.97 max=1072.27
> >
> > My code:
> >
> > load "$NCARG_ROOT/lib/ncarg/nclscripts/csm/gsn_code.ncl"
> > load "$NCARG_ROOT/lib/ncarg/nclscripts/csm/gsn_csm.ncl"
> > load "$NCARG_ROOT/lib/ncarg/nclscripts/csm/contributed.ncl"
> > load "$NCARG_ROOT/lib/ncarg/nclscripts/csm/shea_util.ncl"
> >
> > begin
> >
> > dummy1 = asciiread("NCEP_sum",-1,"float")
> > ncol1 = 6
> > npts1 = dimsizes(dummy1)/ncol1
> > data1 = onedtond(dummy1,(/npts1,ncol1/)) ; npts x ncol
> > data1@_FillValue = -9999999
> > lon1 = data1(:,0)
> > lat1 = data1(:,1)
> > slp1 = data1(:,5)
> > printMinMax(lon1,True)
> > printMinMax(lat1,True)
> > printMinMax(slp1,True)
> >
> > arr1 = new((/73,144/),integer,-999)
> > arr1!0 = "lat1"
> > arr1&lat1=fspan(-90,90,73)
> > arr1&lat1@units = "degrees_north"
> >
> > arr1!1 = "lon1"
> > arr1&lon1=fspan(0,357.5,144)
> > arr1&lon1@units = "degrees_east"
> >
> > printVarSummary(arr1)
> >
> > ; CALCULATION OF DENSITY BY ADDING POINTS OVER SIMILAR POINTS
> > arr1 = 0 ; set array to all 0's
> > do nn = 0,dimsizes(slp1)-1
> > if (.not.ismissing(lat1(nn)).and..not.ismissing(lon1(nn))) then ;
> check to make sure lat/lons are present
> > arr1({lat1(nn)},{lon1(nn)}) = (/ arr1({lat1(nn)},{lon1(nn)})+1 /)
> > end if
> > end do
> >
> > printMinMax(arr1, True)
> >
> > wks = gsn_open_wks("x11","all_st_density_"+i)
> > gsn_define_colormap(wks,"WhiteBlueGreenYellowRed") ; not
> technically necessary
> >
> > res = True
> >
> > ;CONTOUR RESOURCES
> > res@cnFillOn = True
> > res@cnLinesOn = False
> > res@cnLineLabelsOn = False
> >
> > ;GSN RESOURCES
> > res@gsnSpreadColors = True
> > res@gsnDraw = False
> > res@gsnFrame = False
> > res@gsnMaximize = True
> >
> > ;TITLE RESOURCES
> > res@mpLimitMode = "Corners"
> > res@mpLeftCornerLatF = 53.5
> > res@mpLeftCornerLonF = -44.7
> > res@mpRightCornerLatF = 54.2
> > res@mpRightCornerLonF = 135.1
> > res@mpCenterLonF = 0
> > res@mpCenterLatF = 90
> > res@mpProjection = "CylindricalEquidistant"
> > res@cnFillMode = "RasterFill"
> > res@cnLevelSelectionMode = "ExplicitLevels"
> > res@cnLevels = ispan(0,250,15)
> >
> > res@sfXArray = lon1
> > res@sfYArray = lat1
> >
> > res@tiMainString = "The long-term mean cyclone center
> count in summer"
> > map = gsn_csm_contour_map(wks,arr1(:,:),res)
> > draw(map)
> > frame(wks)
> >
> > end
> > <Screen Shot 2014-06-02 at 12.04.43
> PM.png>_______________________________________________
> > ncl-talk mailing list
> > List instructions, subscriber options, unsubscribe:
> > http://mailman.ucar.edu/mailman/listinfo/ncl-talk
>
>
_______________________________________________
ncl-talk mailing list
List instructions, subscriber options, unsubscribe:
http://mailman.ucar.edu/mailman/listinfo/ncl-talk