Date: Mon Jun 16 2014 - 07:34:36 MDT
Hi All
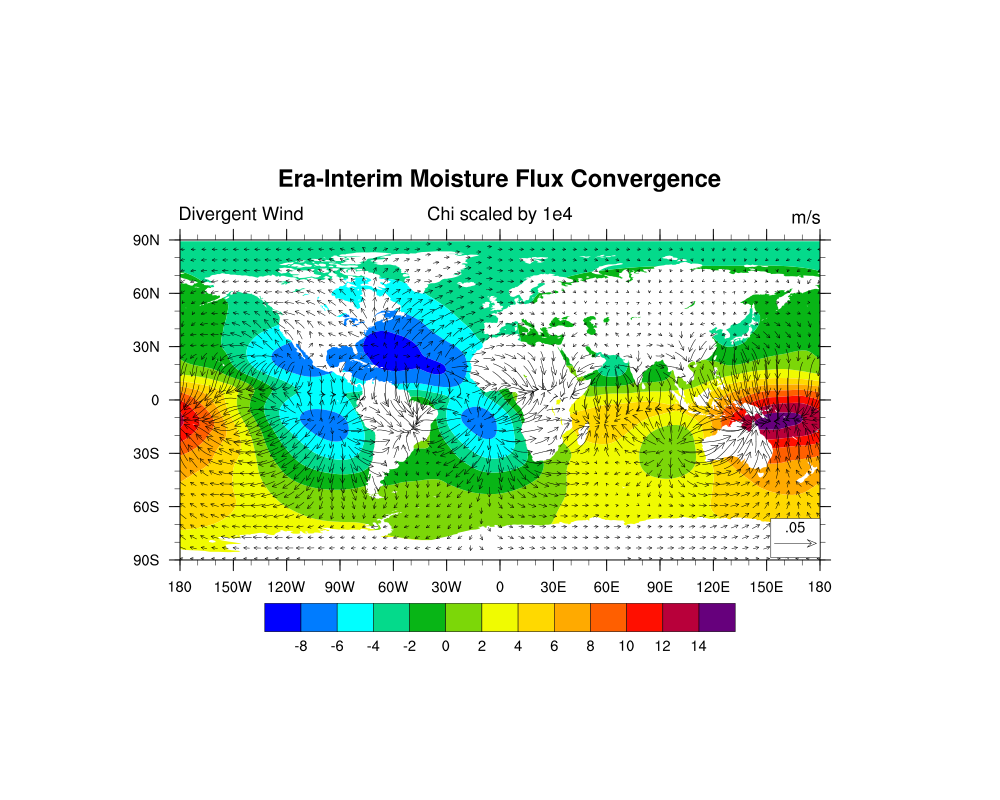
I have calculated the moisture flux convergence with the in built function =
uv2dvG_Wrap
I just have a question about the contours not going on land, I know I am us=
ing the 925hPa level so some of the land wont be covered but I would like t=
o include the contours over the land.
I would appreciate any help in how to go about this.
Below is my code and attached is the image I am getting currently.
Many thanks in advance!
Kind Regards
Melissa
;*************************************************
; wind_3.ncl
;*************************************************
load "$NCARG_ROOT/lib/ncarg/nclscripts/csm/gsn_code.ncl"
load "$NCARG_ROOT/lib/ncarg/nclscripts/csm/gsn_csm.ncl"
load "$NCARG_ROOT/lib/ncarg/nclscripts/csm/contributed.ncl"
;*************************************************
begin
yrStrt = 1979
yrLast = 2013
season = "DJF"
;*************************************************
; open file and read in data: data are on a gaussian grid
;*************************************************
f = addfile ("/mnt/geog/ml382/melphd/MFC/uq_Amon_era-int_safrica_mfc1.nc"=
, "r")
g = addfile ("/mnt/geog/ml382/melphd/MFC/vq_Amon_era-int_safrica_mfc1.nc"=
, "r")
u1 = f->u ; (time,lat,lon)
v1 = g->v
TIME = f->time
YYYY = cd_calendar(TIME,-1)/100 ; entire file
iYYYY = ind(YYYY.ge.yrStrt .and. YYYY.le.yrLast)
TIME1 = g->time
YYYY1 = cd_calendar(TIME1,-1)/100 ; entire file
iYYYY1 = ind(YYYY1.ge.yrStrt .and. YYYY1.le.yrLast)
U = u1(iYYYY,:,:)
V = v1(iYYYY1,:,:)
U@_FillValue = 1e20
V@_FillValue = 1e20
nscan = 2000 ; usually *much* fewer
eps = 0.001 ; variable depended
gtype = True
guess = 1 ; use zonal means
relc = 0.6 ; standard relaxation coef
opt = 0
poisson_grid_fill(U, gtype, guess, nscan, eps, relc, opt)
poisson_grid_fill(V, gtype, guess, nscan, eps, relc, opt)
printVarSummary(U)
printVarSummary(V)
;choose DJF
u = month_to_season(U,season)
v = month_to_season(V,season)
printVarSummary(u)
printVarSummary(v)
;*************************************************
; calculate divergence on a gaussian grid
;*************************************************
div = uv2dvG_Wrap(u,v) ; u,v ==> divergence
;*************************************************
; calculate velocity potential
;*************************************************
chi = ilapsG_Wrap ( div , 0)
chi = (/chi/1e4/) ; arbitrary scale
chi@long_name = "velocity potential"
chi@units = "m/s"
;*************************************************
; calculate divergent wind component
; --
; note: the calculation uses a procedure, so memory
; must be preallocated.
;*************************************************
ud = new ( dimsizes(u), typeof(u), U@_FillValue )
vd = new ( dimsizes(v), typeof(v), V@_FillValue )
dv2uvg(div,ud,vd) ; div ==> divergent wind components
copy_VarCoords(u, ud )
copy_VarCoords(u, vd )
ud@long_name = "Zonal Divergent Wind"
ud@units = u@units
vd@long_name = "Meridional Divergent Wind"
vd@units = v@units
;*************************************************
; plot results
;*************************************************
wks = gsn_open_wks("png","ERA-INT_QUV") ; open a workstation
gsn_define_colormap(wks,"BlAqGrYeOrReVi200") ; choose colormap
res = True
res@cnFillOn = True ; color on
res@cnLinesOn = False ; turn off contour lines
res@gsnScalarContour = True ; vectors over contours
res@gsnSpreadColors = True ; use full colormap
res@gsnSpreadColorEnd = -4 ; last color used
res@vcRefMagnitudeF = 0.05 ; make vectors larger
res@vcRefLengthF = 0.050 ; ref vector length
res@vcGlyphStyle = "CurlyVector" ; turn on curly vectors
res@vcMinDistanceF = 0.012 ; thin the vectors
res@vcRefAnnoOrthogonalPosF = -0.13 ; Move ref anno into plot
;
; This is not necessary in V6.1.0 and later. Named colors can
; be used without having to first add them to the color map.
;
;i = NhlNewColor(wks,0.7,0.7,0.7) ; add gray to colormap
;res@mpLandFillColor = "gray" ; change continent color
res@tiMainString = "Era-Interim Moisture Flux Convergence"
res@gsnCenterString = "Chi scaled by 1e4"
res@gsnLeftString = "Divergent Wind"
plot=gsn_csm_vector_scalar_map_ce(wks,ud(0,:,:),vd(0,:,:),chi(0,:,:),res)
end
_______________________________________________
ncl-talk mailing list
List instructions, subscriber options, unsubscribe:
http://mailman.ucar.edu/mailman/listinfo/ncl-talk