Dear all,
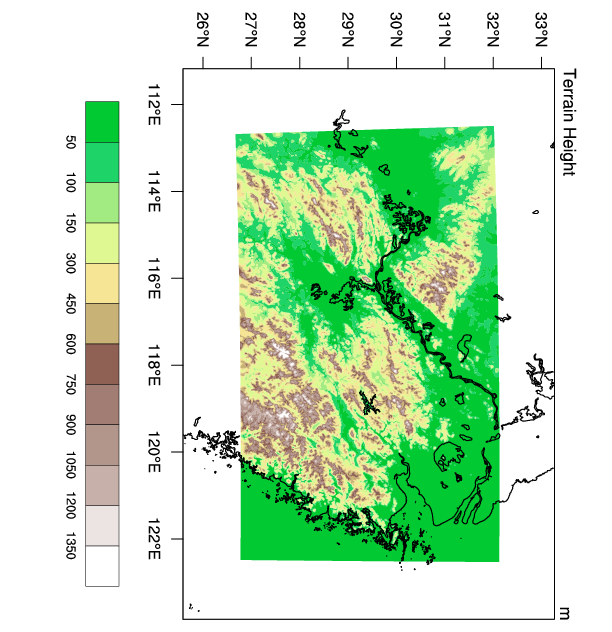
I tried to overlay a box on the terrain from WRF output in Lambert projection.
The terrain height displayed quite well, but the box didn't show up at all (as the attached figure showing).
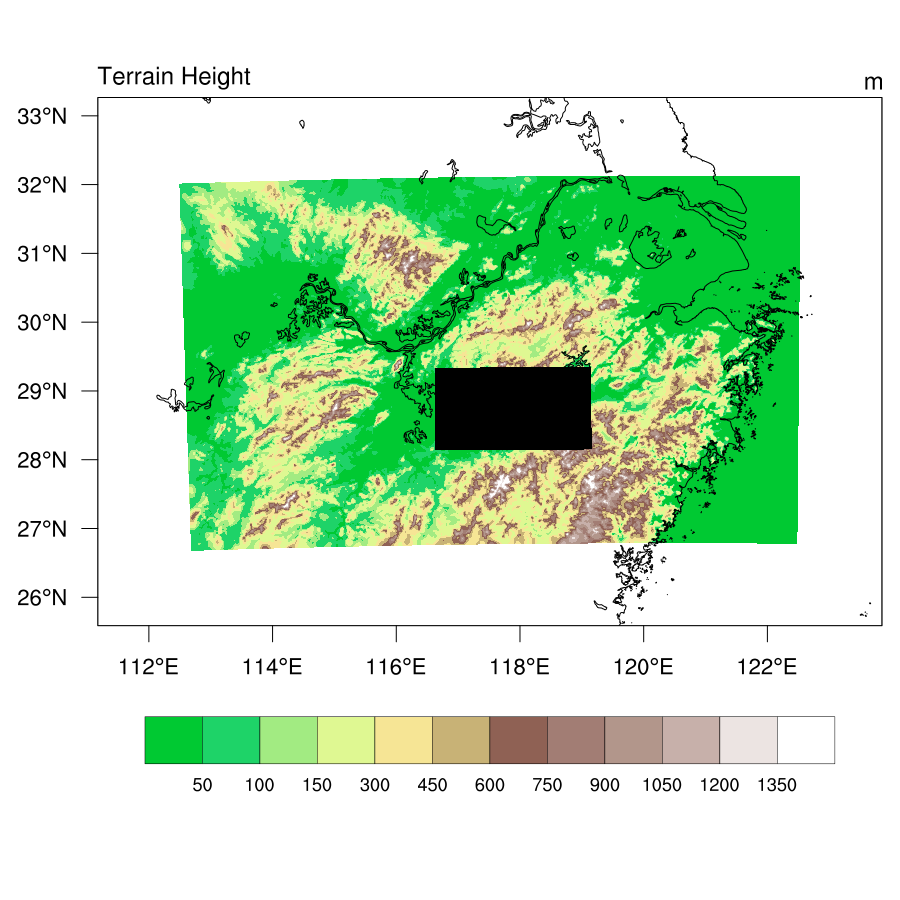
What should be mentioned is that when I use "box = gsn_add_polygon(wks,plot,lon,lat,lnres)" to displace the original code :
"do n = 0 , 3
box(n)=gsn_add_polyline(wks,plot,lat(n:n+1),lon(n:n+1),lnres)
end do",
a filled box showed up successfully. I didn't figure it out.
Here is my complete code:
load "$NCARG_ROOT/lib/ncarg/nclscripts/csm/gsn_code.ncl"
load "$NCARG_ROOT/lib/ncarg/nclscripts/csm/gsn_csm.ncl"
load "$NCARG_ROOT/lib/ncarg/nclscripts/wrf/WRFUserARW.ncl"
;************************************************
begin
;************************************************
; read in netCDF file
;************************************************
a = addfile("wrfout_d03_2011-06-13_18_00_00.nc","r")
ter = a->HGT(0,:,:) ; Read the variable to memory, HGT: terrain height, units = m
mlat = wrf_user_getvar(a,"XLAT",0)
mlon = wrf_user_getvar(a,"XLONG",0)
ter@lat2d = mlat ; Special method for setting 2D lat/lon coords
ter@lon2d = mlon
;************************************************
; create plot
;************************************************
wks = gsn_open_wks("eps" ,"terd03_lambert") ; open a ps file
gsn_define_colormap(wks,"topo_15lev") ; choose colormap
res = True ; plot mods desired
res@gsnDraw = False
res@gsnFrame = False
;res@mpProjection = "LambertConformal"; choose projection
res@mpProjection = "LambertEqualArea"
res@mpFillOn = False ; turn off map fill
res@cnFillOn = True ; turn on color
res@cnLinesOn = False ; turn off contour lines
res@gsnSpreadColors = True ; use full colormap
res@gsnSpreadColorStart = 3 ; start with the second color
;res@lbLabelAutoStride = True ; nice lb labels
; Set contour levels.
res@cnLevelSelectionMode = "ExplicitLevels"
res@cnLevels = (/ 50, 100, 150, 300, 450, 600, 750, \
900, 1050, 1200, 1350/)
res@gsnAddCyclic = False ; regional plot
res@gsnMaximize = True ; enlarge plot
res@mpDataBaseVersion = "HighRes"
res@mpDataSetName = "Earth..4"
res@mpGridAndLimbOn = False ; Turn off lat/lon lines
res@mpOutlineOn = True ; Turn on map outlines
res@mpGeophysicalLineColor = "Black" ; Change the outline line color
res@mpGeophysicalLineThicknessF= 2. ; double the thickness of geophysical boundaries
res@mpOutlineSpecifiers = (/"China","Taiwan","Disputed area between India and China","India:Arunachal Pradesh"/)
res@pmTickMarkDisplayMode = "Always" ; Turn on map tickmarks
res@tmXTLabelsOn = False ; do not draw bottom labels
res@tmXTOn = False ; no bottom tickmarks
res@tmYRLabelsOn = False ; do not draw bottom labels
res@tmYROn = False ; no bottom tickmarks
;---Zoom in on
res@mpLimitMode = "LatLon"
res@mpMinLatF = min(mlat)-1
res@mpMaxLatF = max(mlat)+1
res@mpMinLonF = min(mlon)-1
res@mpMaxLonF = max(mlon)+1
res@mpCenterLonF = 117.547
res@mpCenterLatF = 29.591
;res@gsnMaskLambertConformal = True ; turn on lc masking
;res@gsnMaskLambertConformalOutlineOn = False ; turns off outline
; subset data going into the plot template so that the colorbar reflects only
; the data viewed vice the entire data set
plot = gsn_csm_contour_map(wks,ter,res) ;create plot
;************************************************
; create points for box
;************************************************
lnres = True
lnres@gsLineColor = "Black"
lnres@gsLineThicknessF = 2.5
lat = (/28.3, 29.5, 29.5, 28.3, 28.3/)
lon = (/116.6, 116.6, 119.2, 119.2, 116.6/)
;box = gsn_add_polygon(wks,plot,lon,lat,lnres)
box = new(4,graphic)
; draw each line separately. Each line must contain two points.
do n = 0 , 3
box(n)=gsn_add_polyline(wks,plot,lat(n:n+1),lon(n:n+1),lnres)
end do
draw(plot)
frame(wks)
end
_______________________________________________
ncl-talk mailing list
List instructions, subscriber options, unsubscribe:
http://mailman.ucar.edu/mailman/listinfo/ncl-talk
This archive was generated by hypermail 2.1.8 : Wed Jul 23 2014 - 15:33:46 MDT