Date: Wed Jul 09 2014 - 11:53:00 MDT
Hi,
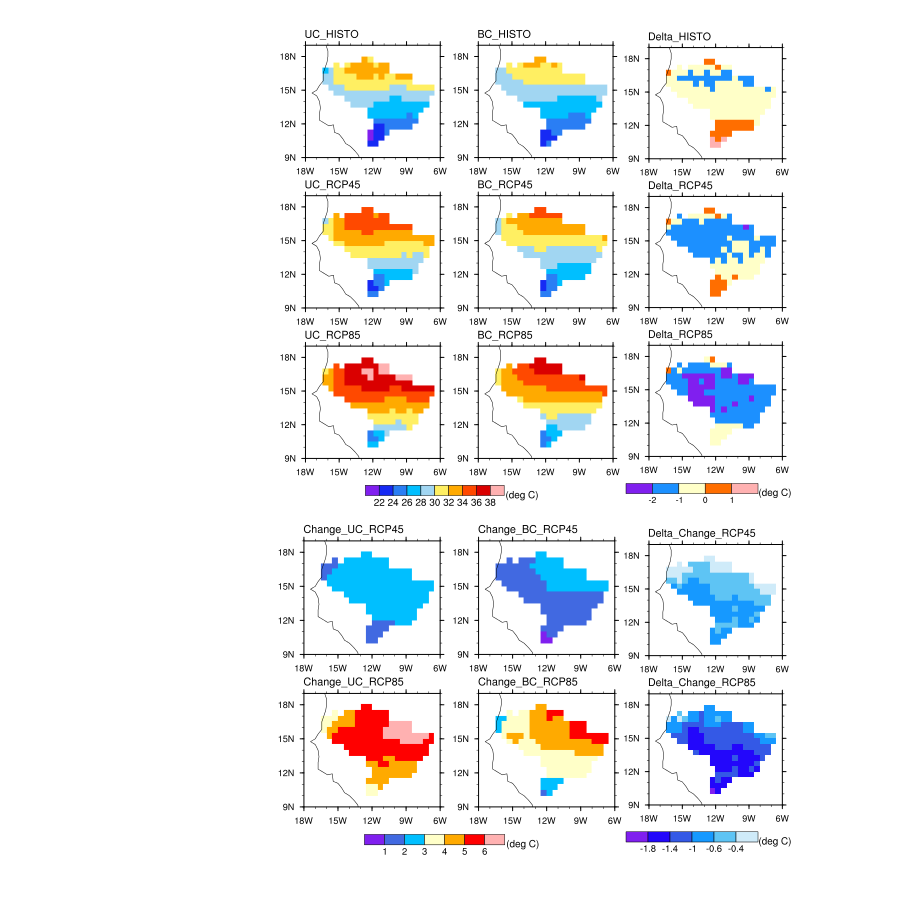
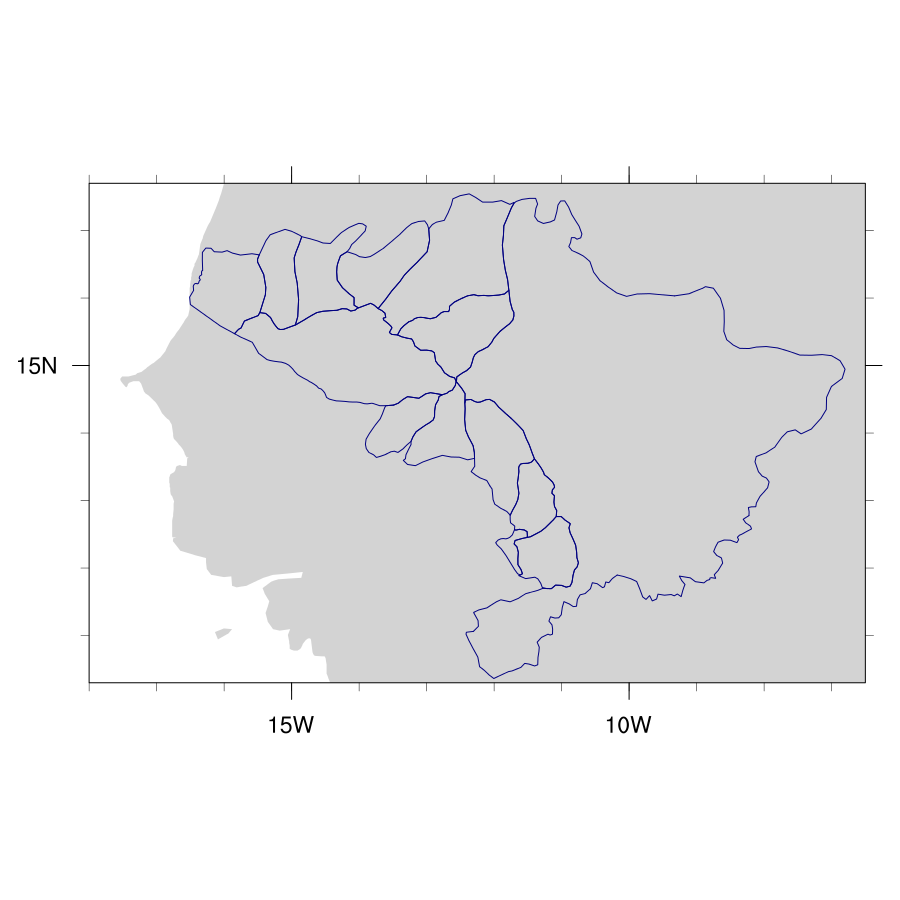
I would like to overlay the shapefile (toto2.png) on each plot of the panel=
(toto1.png). these are the separated scripts:
1-panel plots:
wks = gsn_open_wks("png", "toto1")
plot1 = new(6,graphic)
plot2 = new(4,graphic)
plot3=new(3,graphic)
plot4=new(2,graphic)
res = True
res@gsnMaximize = True
res@gsnDraw = False
res@gsnFrame = False
res@cnInfoLabelOn = False
res@cnFillOn = True
res@cnLinesOn = False
res@cnLineLabelsOn = False
res@gsnAddCyclic = False
res@gsnSpreadColors = True
res@cnFillMode = "RasterFill"
res@lbLabelBarOn = False
res@mpLimitMode="LatLon"
res@mpMinLonF=-18
res@mpMaxLonF=-6
res@mpMinLatF=9
res@mpMaxLatF=19
res@tmXBTickSpacingF= 3
res@tmYLTickSpacingF = 3
;res@tmXBLabelStride = 2
res@gsnRightString=""
res@tmXBLabelFontHeightF =0.025
res@tmYLLabelFontHeightF =0.025
res@cnLevelSelectionMode = "ManualLevels"
res@cnMinLevelValF = 22.
res@cnMaxLevelValF = 38.
res@cnLevelSpacingF = 2.
res@txFontHeightF = 0.03
res@gsnLeftString = "UC_HISTO"
plot1(0) = gsn_csm_contour_map_ce(wks,tas1,res)
res@gsnLeftString = "BC_HISTO"
plot1(1) = gsn_csm_contour_map_ce(wks,tas4,res)
res@gsnLeftString = "UC_RCP45"
plot1(2) = gsn_csm_contour_map_ce(wks,tas2,res)
res@gsnLeftString = "BC_RCP45"
plot1(3) = gsn_csm_contour_map_ce(wks,tas5,res)
res@gsnLeftString = "UC_RCP85"
plot1(4) = gsn_csm_contour_map_ce(wks,tas3,res)
res@gsnLeftString = "BC_RCP85"
plot1(5) = gsn_csm_contour_map_ce(wks,tas6,res)
;-----------------------------------------------Create Panel1-------------=
----------------------------------
resP = True
resP@gsnMaximize = True
resP@lbAutoManage = False
resP@gsnFrame = False
resP@gsnPanelLabelBar = True ; ad=
d common colorbar
resP@lbLabelFontHeightF = 0.008
resP@gsnPanelTop = 0.97
resP@gsnPanelBottom =0.43
resP@gsnPanelYWhiteSpacePercent = 2
resP@gsnPanelXWhiteSpacePercent = 2
resP@lbTitleString ="(deg C)"
resP@lbTitlePosition = "Right"
resP@lbTitleFontHeightF = 0.008
resP@lbTitleDirection = "Across"
;-----------------------------------------------Create Panel2--------------=
---------------------------------
;=========================
====== for baises================
==========================
====
res@cnLevelSelectionMode = "ManualLevels"
res@cnMinLevelValF = 1.
res@cnMaxLevelValF = 6.
res@cnLevelSpacingF = 1.
res@gsnLeftString = "Change_UC_RCP45"
plot2(0) = gsn_csm_contour_map_ce(wks,tas7,res)
res@gsnLeftString = "Change_BC_RCP45"
plot2(1) = gsn_csm_contour_map_ce(wks,tas8,res)
res@gsnLeftString = "Change_UC_RCP85"
plot2(2) = gsn_csm_contour_map_ce(wks,tas9,res)
res@gsnLeftString = "Change_BC_RCP85"
plot2(3) = gsn_csm_contour_map_ce(wks,tas10,res)
;=========================
==Panel for biases ==================
========================
resP2 =True
resP2@gsnMaximize =True
resP2@lbAutoManage =False
resP2@gsnFrame =False
resP2@gsnPanelTop =0.42
resP2@gsnPanelBottom =0.042
resP2@gsnPanelLabelBar =True
resP2@txFontHeightF =0.012 ; a=
dd common colorbar
resP2@lbLabelFontHeightF =0.0075
resP2@gsnPanelYWhiteSpacePercent = 2
resP2@gsnPanelXWhiteSpacePercent = 2
resP2@lbTitleString ="(deg C)"
resP2@lbTitlePosition = "Right"
resP2@lbTitleFontHeightF = 0.008
resP2@lbTitleDirection = "Across"
;-------------------------------------------------DELTA_1 ----------------=
--------------------------
res@cnLevelSelectionMode = "ManualLevels"
res@cnMinLevelValF = -2.
res@cnMaxLevelValF = 1.
res@cnLevelSpacingF = 1.
res@gsnLeftString = "Delta_HISTO"
plot3(0) = gsn_csm_contour_map_ce(wks,d10,res)
res@gsnLeftString = "Delta_RCP45"
plot3(1) = gsn_csm_contour_map_ce(wks,d20,res)
res@gsnLeftString = "Delta_RCP85"
plot3(2) = gsn_csm_contour_map_ce(wks,d30,res)
;=========================
==Panel delta_1 ===================
=======================
resP3 =True
resP3@gsnMaximize =True
resP3@lbAutoManage =False
resP3@gsnFrame =False
resP3@gsnPanelLeft =0.69
resP3@gsnPanelRight =0.88
resP3@gsnPaneltop =0.98
resP3@gsnPanelBottom =0.4
resP3@gsnPanelLabelBar =True
resP3@txFontHeightF =0.01 ; ad=
d common colorbar
resP3@lbLabelFontHeightF =0.007
resP3@gsnPanelYWhiteSpacePercent = 2
resP3@gsnPanelXWhiteSpacePercent = 2
resP3@lbTitleString ="(deg C)"
resP3@lbTitlePosition = "Right"
resP3@lbTitleFontHeightF = 0.008
resP3@lbTitleDirection = "Across"
;-----------------------------------------DELTA_2-------------------------=
-------------------------
res@cnLevelSelectionMode = "ManualLevels"
res@cnMinLevelValF = -1.8
res@cnMaxLevelValF = -0.4
res@cnLevelSpacingF = 0.4
res@cnFillColors = (/2,18,40,70,100,128/)
res@gsnLeftString = "Delta_Change_RCP45"
plot4(0) = gsn_csm_contour_map_ce(wks,d40,res)
res@gsnLeftString = "Delta_Change_RCP85"
plot4(1) = gsn_csm_contour_map_ce(wks,d50,res)
;=========================
==Panel delta_2 ===================
=======================
resP4 =True
resP4@gsnMaximize =True
resP4@lbAutoManage =False
resP4@gsnFrame =False
resP4@gsnPanelLeft =0.044
resP4@gsnPanelRight =0.46
resP4@gsnPanelLabelBar =True
resP4@txFontHeightF =0.012 ; a=
dd common colorbar
resP4@lbLabelFontHeightF =0.0075
resP4@gsnPanelLeft =0.69
resP4@gsnPanelRight =0.88
resP4@gsnPanelTop =0.46
resP4@gsnPanelBottom =0.001
resP4@gsnPanelYWhiteSpacePercent = 2
resP4@gsnPanelXWhiteSpacePercent = 2
resP4@lbTitleString ="(deg C)"
resP4@lbTitlePosition = "Right"
resP4@lbTitleFontHeightF = 0.008
resP4@lbTitleDirection = "Across"
gsn_panel(wks,plot1,(/3,2/),resP)
gsn_panel(wks,plot2,(/2,2/),resP2)
gsn_panel(wks,plot3,(/3,1/),resP3)
gsn_panel(wks,plot4,(/2,1/),resP4)
frame(wks)
end
2-shapefile:
wks = gsn_open_wks("png","toto2") ; Open X11 window for graphics
res = True ; Set some plot options
res@gsnMaximize = True ; maximize plot in frame
res@mpMinLatF = 10.30
res@mpMaxLatF =17.7
res@mpMinLonF = -18.0
res@mpMaxLonF = -6.5
res@mpDataBaseVersion = "MediumRes" ; "LowRes", "HighRes"
;res@tiMainString = shapefile_name ; Main title
plot = gsn_csm_map(wks,res)
lnres = True ; Set some line options
lnres@gsLineThicknessF = 2.0 ; default is 1.0
lnres@gsLineColor = "NavyBlue" ; default is black
; lnres@gsLineDashPattern = 2 ; default is 0 (solid)
id = gsn_add_shapefile_polylines(wks,plot,shapefile_name,lnres)
draw(plot)
frame(wks)
end
Thanks in advance
Mamadou,
Regards
_______________________________________________
ncl-talk mailing list
List instructions, subscriber options, unsubscribe:
http://mailman.ucar.edu/mailman/listinfo/ncl-talk