NCL_GETools API
September 10, 2013
Updated May 22, 2014
Introduction
NCL_GETools is a library for generating KML output with NCL. It was developed by Mohammad Abouali during the summer 2013 SIParCS internship program. The library is being made available on a preliminary basis to gauge user interest and to gather further use-cases and requirements. Given sufficient interest, the library may be further developed and become a standard component of NCL. Note that NCL_GETools requires NCL v6.2.0 or later.
The library consists of a set of 7 high-level procedures. Each procedure accepts a resources argument, as per common NCL idiom; this argument is typically a boolean variable, assigned the value True, onto which one or more resource-attributes are attached. A rich set of new resources have been introduced with NCL_GETools to control various aspects of the graphical appearance and behavior of the KML output when rendered within Google Earth. Each resource has a suitable default setting.
It should be noted in passing that an alternative KML library for NCL has been developed by Ryan Pavlick. That API operates at a level closer to the underlying KML structure, and as such, is both inherently more powerful but likely requires more knowledge about KML. See https://github.com/rpavlick for Ryan’s KML-library and a collection of other tools he has developed for NCL.
Users access the procedures that comprise NCL_GETools by including the following line in their scripts:
load
"$NCARG_ROOT/lib/ncarg/nclscripts/contrib/NCL_GETools.ncl"
The procedures and the resources they accept are described next. Familiarity with Google Earth is presumed.
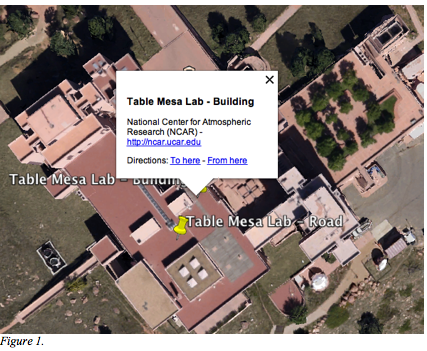
Point2KML
Generates a georeferenced marker, along with optional annotations, as seen in Figure 1. The geolocation may be specified either by longitude-latitude values, or via postal address.
Prototype
procedure Point2KML(
filename
: string
opt :
logical
)
Arguments
|
filename |
A name for the resultant KML output file. |
|
opt |
Optional resources. |
Resources recognized
|
Visibility : boolean |
Determines whether the marker is initially visible when the KML is loaded into Google Earth. |
|
Description : string |
Free-form text that appears in the annotation panel associated with the marker (see Fig. 1). |
|
Lon : float Lat : float |
Specifies the longitude and latitude values respectively of the marker's location. |
|
Address : string |
Specifies the location of the marker via postal address. Note if both Address and Lon/Lat are given, Address will be ignored. |
|
StoragePath : string |
A pathname prefix for the KML output file. The default is the current directory. |
|
Verbose : boolean |
When set to True, Point2KML writes diagnostic output to stdout. Default is False. |
Examples
The two markers shown in Fig. 1 were generated by the following scripts. Location specified by address:
load
"$NCARG_ROOT/lib/ncarg/nclscripts/contrib/NCL_GETools.ncl"
begin
;
This example shows how to create a point based on known address
Opt=True
Opt@Name="Table
Mesa Lab - Road"
Opt@Address="1850
Table Mesa Drive, Boulder, CO"
Opt@Description="The
road to National Center for Atmospheric Research (NCAR) -
http://ncar.ucar.edu"
Opt@Verbose=True
kml_FileName="NCAR_ML"
Point2KML(kml_FileName,
Opt)
end
Location specified by longitude-latitude:
load
"$NCARG_ROOT/lib/ncarg/nclscripts/contrib/NCL_GETools.ncl"
begin
;
This example shows how to create a point based on known lat/lon Coordinate
Opt=True
Opt@Name="Table
Mesa Lab - Building"
Opt@Lat=39.9779329120415
Opt@Lon=-105.2749947520585
Opt@Description="National
Center for Atmospheric Research (NCAR) - http://ncar.ucar.edu"
Opt@Verbose=True
kml_FileName="NCAR_MLB"
Point2KML(kml_FileName,
Opt)
end
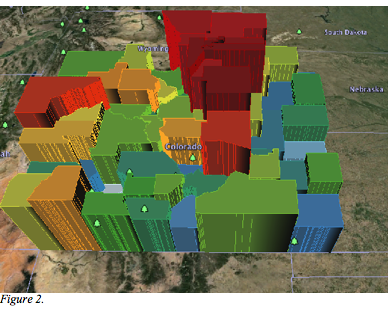
SHP2KML
Generates extruded polygons from a Shapefile. Figure 2 depicts population data for Colorado counties by height and coloring of the polygons.
Prototype
procedure SHP2KML(
shapefileName : string
kmlOutputFile : string
opt :
logical
)
Arguments
|
shapefileName |
filename of the shapefile to be read. |
|
kmlOutputName |
filename for the KML output file. |
|
opt |
optional resources. |
Resources recognized
|
VarName : string |
Name of the variable within the shapefile that should be used to determine height and/or coloring of the polygons. Must be specified. |
|
MinData : numeric MaxData : numeric |
These resources can be used to clamp the range of values for variable VarName. |
|
NoData : numeric |
Value to indicate missing data in VarName. |
|
MakeLogScale : boolean |
Apply a log-scale in mapping VarName values to colors/height. Default is False. |
|
Extrude : boolean |
Determines whether polygons should be extruded along the vertical axis. The default is True. |
|
MinH : float MaxH : float |
Minimum and maximum height of the extruded polygons, in meters. |
|
AltMode : enum |
Altitude-Mode - determines how extruded polygons are positioned in space. Valid values are: absolute, clampToGround, clampToSeaFloor, relativeToGround, relativeToSeaFloor. Default is absolute. |
|
ConstHeight : float |
Extrude polygons to a constant height (meters). Default is 3000m. |
|
Colormap : string |
Name of the colormap to be used for coloring polygons. Default is the “WhiteBlueGreenYellowRed” colormap. |
|
ReverseColorMap : Boolean |
Map colors to VarName values in reverse order. Default is False. |
|
UseConstOpacity : Boolean |
Whether to color polygons with a fixed opacity. Default is False |
|
ConstOpacity : float |
Opacity for coloring the polygons, in the range 0 (transparent) to 100 (opaque). Default is 50. |
|
LineWidth : float |
Width of the borderlines of the polygons. |
|
Name : string |
A descriptive label generated into the KML. |
|
Tesselate : boolean |
??? |
|
StoragePath : string |
A pathname prefix for the KML output file. The default is the current directory. |
|
Verbose : boolean |
When set to True, writes diagnostic output to stdout. Default is False. |
Examples
load
"$NCARG_ROOT/lib/ncarg/nclscripts/contrib/NCL_GETools.ncl"
begin
SHPFileName="../ExampleData/ColoradoCounty/ColoradoCounty.shp"
kml_FileName="ColoradoCounty"
Opt=True
;
The variable name inside the Shapefile that stores the population
;
The height of the polygons and the color is calculated based on
;
this variable.
Opt@VarName="POP_2008"
Opt@Name="County
Populations"
Opt@Verbose=True
Opt@MakeLogScale=True
Opt@MinH=50000 ;
the minimum height [m]
Opt@MaxH=300000 ; the
maximum height [m]
SHP2KML(SHPFileName,kml_FileName,Opt)
end
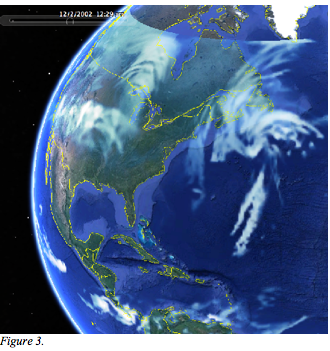
RasterTimeSeries2KML
Generates color plots from a time series, which may then be animated within Google Earth (Figure 3).
Prototype
procedure RasterTimeSeries2KML(
filename : string
rasterData[*][*][*] : numeric
xCoords[*][*] : numeric
yCoords[*][*] : numeric
timeTag[*] : string
opt :
boolean
)
Arguments
|
filename |
Filename for the KML output file. |
|
rasterData |
The variable to be mapped. The shape is assumed to be [time][row][col]. |
|
xCoords |
Longitudinal values for the raster grid; [row][column]. |
|
yCoords |
Latitudinal values for the raster grid [row][column]. |
|
timeTag |
String representation of the time coordinate values [time]. |
|
Opt |
Optional resources. |
Resources recognized
|
North : numeric South : numeric East : numeric West : numeric |
May be used to clip out a spatial subset of the input data. |
|
MinData : numeric MaxData : numeric |
These resources can be used to clamp the range of values in the grid. |
|
Altitude : numeric |
Altitude (meters) at which to position the color plot. |
|
Extrude : boolean |
Determines whether the raster should be extruded along the vertical axis. The default is True. |
|
AltMode : enum |
Altitude-Mode - determines how the extruded raster is positioned in space. Valid values are: absolute, clampToGround, clampToSeaFloor, relativeToGround, relativeToSeaFloor. Default is absolute. |
|
PixelRatio : float |
??? |
|
Colormap : string |
Name of the colormap to be used for coloring polygons. Default is the “WhiteBlueGreenYellowRed” colormap. |
|
ReverseColorMap : Boolean |
Map colors to VarName values in reverse order. Default is False. |
|
ConstOpacity : float |
Opacity for coloring the polygons, in the range 0 (transparent) to 100 (opaque). Ignored by default. |
|
MinDataOpacity, MaxDataOpacity : numeric |
Can be used to apply a linear ramp of varying opacity across the range of grid values. Specified in the range 0 (transparent) to 100 (opaque). |
|
GridVisibility : boolean |
Display the raster gridlines. Default is False. |
|
GridAltitude : numeric |
Altitude at which to display gridlines, in meters. Default is Altitude+3000. |
|
LineWidth : float |
Width for gridlines. Default is “1” (in units of pixels?) |
|
LineRedColor, LineGreenColor, LineBlueColor : numeric |
Red, green blue components that make up the color of the gridlines. Specified in the range of 0 to 255. Default triplet is 255,0,255. |
|
LineOpacity : numeric |
Opacity of the gridlines, in the range 0 (transparent) to 100 (opaque). Default is 100. |
|
Name : string |
A descriptive label generated into the KML. |
|
Tesselate : boolean |
??? |
|
Overwrite: boolean |
??? Default is False. |
|
ForceOverWrite: Boolean |
??? Default is False. |
|
NameList: string[*] |
??? |
|
CoordSystem |
??? |
|
CoordUnits |
??? Default is “degrees” |
|
InterpMethod |
??? Default is “bilinear” |
|
InterpWeightFile : string |
??? Default is Filename + “_wgt.nc” |
|
KeepInterpWeightFile : Boolean |
??? Default is True |
|
SrcRegional : boolean |
??? Default is True. |
|
DstRegional : boolean |
??? Default is True. |
|
Rotation : numeric |
??? Default is 0. |
|
DataSetTitle : string |
??? Default is “--” |
|
StoragePath : string |
A pathname prefix for the KML output file and PNGs. The default is the current directory. |
|
Verbose : boolean |
When set to True, writes diagnostic output to stdout. Default is False. |
Example
load
"$NCARG_ROOT/lib/ncarg/nclscripts/contrib/NCL_GETools.ncl"
begin
fid=addfile("../ExampleData/ds601.0_RCPP/olr_RCPP_2002_12.nc","r")
nFrames=20;
olr=fid->OLR(0:nFrames,:,:)
lat=fid->XLAT
lon=fid->XLONG
TimeTag=tostring(fid->Times(0:nFrames,:))
Opt=True
Opt@Verbose=True
Opt@ColorMap="WhiteBlue"
Opt@DataSetTitle="Outgoing
Longwave Radiation"
Opt@MinData=100.0
Opt@MaxData=250.0
Opt@MinDataOpacity=100
Opt@MaxDataOpacity=0
Opt@IncludeGrid=True
;
The following command will create a KML file, called olr12.kml,
;
in the current directory, since the first argument, i.e.
;
the PATH, is set to "."
RasterTimeSeries2KML("olr_200212_21F_VarAlpha",olr,lon,lat,TimeTag,Opt)
end
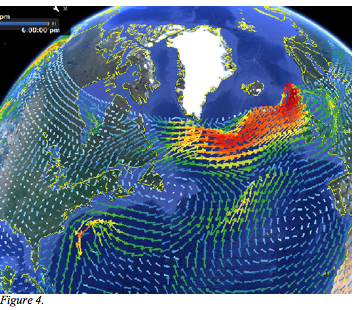
Velocity2KML
Generates a vector plot of time-series data (Figure 4).
Protoype
procedure Velocity2KML(
filename[1] : string
u[*][*][*] : float
v[*][*][*] : float
lat[*][*] : float
lon[*][*] : float
timeTag[*] : string
opt :
logical
)
Arguments
|
filename |
Filename for the KML output file. |
|
u, v |
U/V vector components, shaped as [time][row][col] |
|
lat, lon |
Coordinates of vector components, shaped as [row][col]. |
|
timeTag |
String representation of the time coordinate values [time]. |
|
opt |
Optional resources. |
Resources recognized
|
IStride, JStride: int |
Strides across U/V components. Default is 1. |
|
Extrude : boolean |
Determines whether the raster should be extruded along the vertical axis. The default is True. |
|
Height : numeric |
Altitude at which to plot vectors. Default is 3000 meters. |
|
AltMode : enum |
Altitude-Mode - determines how the extruded raster is positioned in space. Valid values are: absolute, clampToGround, clampToSeaFloor, relativeToGround, relativeToSeaFloor. Default is absolute. |
|
UseConstColor : boolean |
Use a constant color to shade vector glyphs, as specified via Line[Red/Green/Blue]Color resources. Default is False. |
|
LineRedColor, LineGreenColor: LineBlueColor : numeric |
Red, green, blue components for vectors shaded a constant color, specified as values between 0 and 255. Default is 255,0,255 (i.e., magenta). |
|
LineOpacity : float |
Opacity of the vectors, in the range 0 (transparent) to 100 (opaque). Default is 100. |
|
LineWidth : numeric |
Width of the vector glyphs (in pixels?). Default is 1. |
|
ColorMap : string |
Specifies a colormap used to color vectors by magnitude. Default is "WhiteBlueGreenYellowRed". |
|
Name : string |
Title given to the plot. |
|
ArrowScale |
??? |
|
Tesselate |
??? |
|
StoragePath : string |
A pathname prefix for the KML output file and PNGs. The default is the current directory. |
|
Verbose : boolean |
When set to True, writes diagnostic output to stdout. Default is False. |
Example
load
"$NCARG_ROOT/lib/ncarg/nclscripts/contrib/NCL_GETools.ncl"
begin
fidu=addfile("../ExampleData/ds601.0_RCPP/u10_RCPP_2002_12.nc","r")
fidv=addfile("../ExampleData/ds601.0_RCPP/v10_RCPP_2002_12.nc","r")
nFrames=4
u=fidu->U10(0:nFrames,:,:)
v=fidv->V10(0:nFrames,:,:)
lat=fidv->XLAT
lon=fidv->XLONG
TimeTag=tostring(fidv->Times(0:nFrames,:))
Opt=True
Opt@Verbose=True
Opt@IStride=5;
Opt@JStride=5;
Opt@ArrowScale=20000.0
Opt@Name="RCPP
2002 12 Velocity"
Opt@LineWidth=3;
Opt@Height=20000
Velocity2KML("velocity_200212_HR_5F",
u, v, lat, lon, TimeTag, Opt)
end
Path2KML
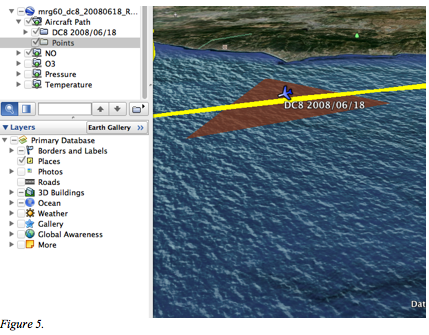
Draws a georeferenced trajectory, such as the flight path of an aircraft (the yellow line in Figure 5.)
Prototype
procedure Path2KML(
filename : string
lat[*]
: numeric
lon[*]
: numeric
height[*] : numeric
timeTag[*] : string,
opt :
logical
)
Arguments
|
filename |
Filename for the KML output file. |
|
lat, lon, height |
X/Y/Z coordinates of the trajectory waypoints. |
|
timeTag |
String representation of the time coordinate values [time]. |
|
opt |
Optional resources. |
Recognized resources
|
PathName : string |
Name embedded into KML file. |
|
LineWidth : numeric |
Width of the line depicting the trajectory (in pixels?). Default is 1. |
|
LineRedColor, LineGreenColor, LineBlueColor : numeric |
The red/green/blue components of the trajectory line color, given in values from 0 to 255. Default is 255,255,0 (i.e., yellow). |
|
LineOpacity : float |
Opacity of the trajectory line, in the range 0 (transparent) to 100 (opaque). |
|
IconName : string |
Icon used to mark waypoints along the trajectory. The name comes from a long list of possibilities supported by Google Earth (a large list has been compiled into the get_KML_IconRef() function, within the NCL_GETools.ncl source code). Default is “ylw-pushpin”. |
|
PointRedColor, PointGreenColor, PointBlueColor : numeric |
Color components of the waypoint markers, specified in values from 0 to 255. Default is 255,255,255 (white). |
|
PointOpacity : float |
Opacity of the waypoint markers, in the range 0 (transparent) to 100 (opaque). |
|
AdjustHeader : logical |
If true, the icon is rotated to point in the direction along the trajectory. Default is False. |
|
Extrude : boolean |
Determines whether the trajectory should be extruded along the vertical axis. The default is False. |
|
AltMode : enum |
Altitude-Mode - determines how the extruded raster is positioned in space. Valid values are: absolute, clampToGround, clampToSeaFloor, relativeToGround, relativeToSeaFloor. Default is relativeToGround. |
|
Tesselate : logical |
??? Default is True. |
|
StoragePath : string |
A pathname prefix for the KML output file and PNGs. The default is the current directory. |
|
Verbose : boolean |
When set to True, writes diagnostic output to stdout. Default is False. |
Example
load
"$NCARG_ROOT/lib/ncarg/nclscripts/contrib/NCL_GETools.ncl"
begin
;
;
LOADING DATA
;
Data=read_ict("../ExampleData/Aircraft/mrg60_dc8_20080618_R13.ict")
lat=Data(:,5);
lon=where(Data(:,6).gt.180,Data(:,6)-360,Data(:,6))
z=Data(:,15)*1000.0
; converting to meter.
;
;
Getting Time String in the format of yyyy-mm-dd_hh:mm:ss
;
YYYY=tointeger(str_get_field(Data@Header(6),1,"
"))
Date=jul2greg(Data(:,1)+tointeger(greg2jul(YYYY,1,1,1)))
hh=tointeger(Data(:,0)/3600.0)
mm=tointeger((Data(:,0)-hh*3600.0)/60)
ss=tointeger(Data(:,0)-hh*3600.0-mm*60)
TimeTagStr=
sprinti("%0.4i",Date(:,0))+"-" \
+sprinti("%0.2i",Date(:,1))+"-"
\
+sprinti("%0.2i",Date(:,2))+"_"
\
+sprinti("%0.2i",hh)+":"
\
+sprinti("%0.2i",mm)+":"
\
+sprinti("%0.2i",ss);
;
;
Exporting the Path to KML
;
Opt=True
Opt@Verbose=True
Opt@PathName="DC8
2008/06/18"
Opt@IconName="airports"
Opt@LineWidth=5.0
Opt@AdjustHeading=True
Path2KML("Aircraft",
lat,lon,z,TimeTagStr,Opt)
end
Measurements2KML
Plots colored and shaped polygons to reflect a scalar quantity. Originally was conceived as a means to plot measurements from air-borne instrumentation. The triangle shape and color in Figure 5 depicts nitric-oxide values as measured by the aircraft at that instant during its flight.
Prototype
procedure Measurements2KML(
filename : string
lat[*]
: numeric
lon[*]
: numeric,
height[*]
: numeric
inData[*] : numeric
timeTag[*] : string
opt :
logical
)
Arguments
|
filename |
Filename for the KML output file. |
|
lat, lon, height |
X/Y/Z coordinates of the trajectory waypoints. |
|
inData |
The measured data. |
|
timeTag |
String representation of the time coordinate values [time]. |
|
Opt |
Optional resources. |
Recognized Resources
|
NsidePolygon : int |
Draw an N-sided polygon shape at each measurement location. Default is 20 (approximates a circle). |
|
Rotation : float |
Rotate the N-sided polygon, specified in degrees. |
|
DataSetName : string |
Descriptive text that gets embedded into the KML file. |
|
Colormap : string |
Name of the colormap used to color the polygons, based upon the data value. Default is “WhiteBlueGreenYellowRed”. |
|
UseLogScale : boolean |
Apply a log-10 scale to map data onto the colormap. |
|
ConstOpacity : float |
Opacity of the color polygons, in the range 0 (transparent) to 100 (opaque). |
|
UseConstSize : boolean |
If True, polygons are drawn in a fixed size. If False, the size of the polygon reflects the value of the underlying measurement value. Default is False. |
|
ShowOutline : logical |
If True, draws the outline of the polygon. Default is False. |
|
Fill : boolean |
If True, color-fills the interior of the polygon. Default is True. |
|
MinData, MaxData : numeric |
Used to clamp the range of values in the measurement data |
|
DataScale : float |
Scale factor applied to the measurement data. Default is 20000(?) |
|
Tesselate : boolean |
??? Default is True. |
|
AltMode : enum |
Altitude-Mode - determines how the extruded polygon is positioned in space. Valid values are: absolute, clampToGround, clampToSeaFloor, relativeToGround, relativeToSeaFloor. Default is relativeToGround. |
|
Extrude : boolean |
??? Default is False. |
|
StoragePath : string |
A pathname prefix for the KML output file and PNGs. The default is the current directory. |
|
Verbose : boolean |
When set to True, writes diagnostic output to stdout. Default is False. |
Example
load
"$NCARG_ROOT/lib/ncarg/nclscripts/contrib/NCL_GETools.ncl"
begin
;
;
LOADING DATA
;
Data=read_ict("../ExampleData/Aircraft/mrg60_dc8_20080618_R13.ict")
lat=Data(:,5);
lon=where(Data(:,6).gt.180,Data(:,6)-360,Data(:,6))
z=Data(:,15)*1000.0
; converting to meter.
;
;
Getting Time String in the format of yyyy-mm-dd_hh:mm:ss
;
YYYY=tointeger(str_get_field(Data@Header(6),1,"
"))
Date=jul2greg(Data(:,1)+tointeger(greg2jul(YYYY,1,1,1)))
hh=tointeger(Data(:,0)/3600.0)
mm=tointeger((Data(:,0)-hh*3600.0)/60)
ss=tointeger(Data(:,0)-hh*3600.0-mm*60)
TimeTagStr=
sprinti("%0.4i",Date(:,0))+"-" \
+sprinti("%0.2i",Date(:,1))+"-"
\
+sprinti("%0.2i",Date(:,2))+"_"
\
+sprinti("%0.2i",hh)+":"
\
+sprinti("%0.2i",mm)+":"
\
+sprinti("%0.2i",ss);
;
;
Exporting the Measurments to KML
;
Opt@DataSetName="NO"
Opt@DataScale=10000.0;
Opt@NSidePolygon=3;
Opt@Rotation=90.0;
Opt@UseLogScale=True
Opt@UseConstSize=True
Measurements2KML("Measurements_NO",
lat, lon, z, Data(:,44),TimeTagStr,Opt)
end
Collect_KMLs
A convenience function to collect several disparate KML files into one.
Prototype
procedure Collect_KMLs(
outFilename[1] : string
inFileList[*] : string
opt :
logical
)
Arguments
|
outFilename |
Name for the combined KML file. |
|
inFileList |
An array of filenames of KML files to be combined. |
|
opt |
Optional resources. |
Recognized resources
|
NameList: string[*] |
Optional: A list of descriptive labels associated with each input KML file. |