Hi,
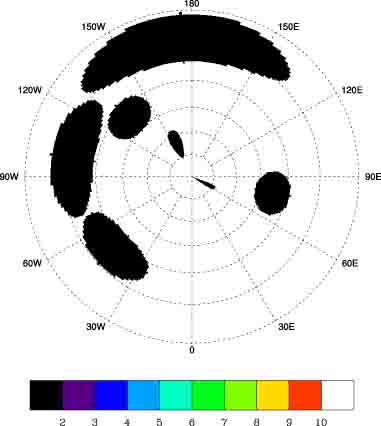
I am trying to plot a 360x360 array on a contour polar coordiate, using
gsn_csm_contour_map_polar. It seems like the code leaves out the whole
chunk of data on radial axis. Do you have any idea why it does that?
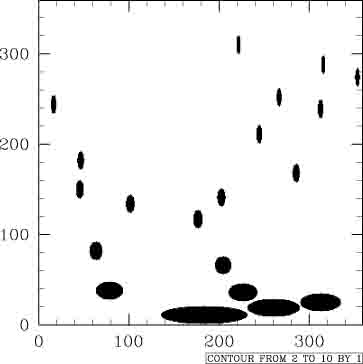
Attach here are the gsn_csm_contour_map_polar plot (the wrong one) and the
cartesian plot (the correct one). Notice how the polar plot only contains
seven spots, all lie on the lower portion of the cartesian plot.
thank you
PS. and here is the code for polar plot.
begin
f = asciiread("snakefield.dat",(/360,360/),"float")
wks = gsn_open_wks ("pdf", "tempo")
cnres = True
cnres_at_cnRasterModeOn = True
cnres_at_cnLinesOn = False
cnres_at_cnLineLabelsOn = False
cnres_at_cnFillOn = True
cnres_at_gsnSpreadColors = True
cnres_at_mpOutlineOn = False
gsn_define_colormap (wks, "rainbow+white")
plot = gsn_csm_contour_map_polar(wks,11-f,cnres)
end
_______________________________________________
ncl-talk mailing list
ncl-talk_at_ucar.edu
http://mailman.ucar.edu/mailman/listinfo/ncl-talk
This archive was generated by hypermail 2.2.0 : Mon Jul 31 2006 - 11:31:36 MDT