Date: Thu, 21 Sep 2006 16:06:05 -0500
Hello,
I'm just trying to plot some data inside California, but I don't want
Nevada or other surrounding states to show up in the plot.
I can do that via:
res_at_mpOutlineOn = True
res_at_mpPerimOn = True
res_at_mpOutlineBoundarySets = "NoBoundaries"
res_at_mpDataBaseVersion = "mediumres"
res_at_mpOutlineSpecifiers = "California"
plot = gsn_csm_contour_map_ce(wks,data,res)
and that works just fine. However, I'd also like to have
California's counties outlined as well. I was trying to do as this
examples does:
http://www.ncl.ucar.edu/Applications/Scripts/maponly_10.ncl (as it
only draws counties for FL)
So, I've tried:
ca_counties = (/"list all 58 counties here"/)
res_at_mpDataSetName = "Earth..2"
res_at_mpOutlineBoundarySets = "NoBoundaries"
res_at_mpOutlineSpecifiers = "California . " + ca_counties
plot = gsn_csm_contour_map_ce(wks,data,res)
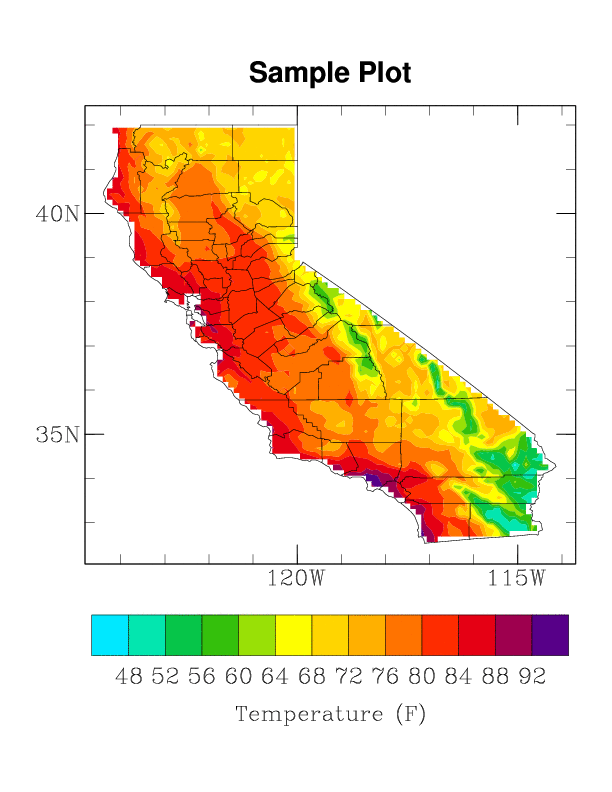
But using that approach doesn't quite work as there isn't a
completely closed outline of CA (notably around Lake Tahoe and the
upper northwest corner, see attached, those areas are Del Norte and
El Dorado counties, which are in my list of counties). Those areas
are fine with I only plot the state by itself.
So, I'm certainly doing something wrong and I'm hoping that someone
can point out to me what that is.
Thanks for any suggestions,
Jeff
.
_______________________________________________
ncl-talk mailing list
ncl-talk_at_ucar.edu
http://mailman.ucar.edu/mailman/listinfo/ncl-talk
