Hi Yi,
In order to change the tickmark labels to explicit things
like "Jan 01", you need to use three resources:
res_at_tmXBMode = "Explicit"
res_at_tmXBValues = (/ 0, 1, 2 , 3,.../)
res_at_tmXBLabels = (/"Jan 01","Jan 10","Jan 20", ,.../)
The tmXBValues resource needs to be set to the X values where you
actually want tickmarks and labels, and the tmXBLabels resource
should be an array of the same length indicating what labels you want
at those tickmarks.
You can see an example at:
http://www.ncl.ucar.edu/Applications/tickmarks.shtml
(See example 2).
--Mary
On Thu, 17 Jan 2008, Wang, Yi wrote:
> HI Folks:
>
> How can I specify the X-axis in date/time?
>
> I mean can we change the tick marks in X-axis from 0, 1,2,3.....
>
> To:
>
> Jan 01, Jan 10, Jan 20........
>
> You can see examples here:
>
> <http://www.ncl.ucar.edu/Applications/Images/h_time_3_lg.png>
>
> Code here:
>
> <http://www.ncl.ucar.edu/Applications/Scripts/h_time_3.ncl>
>
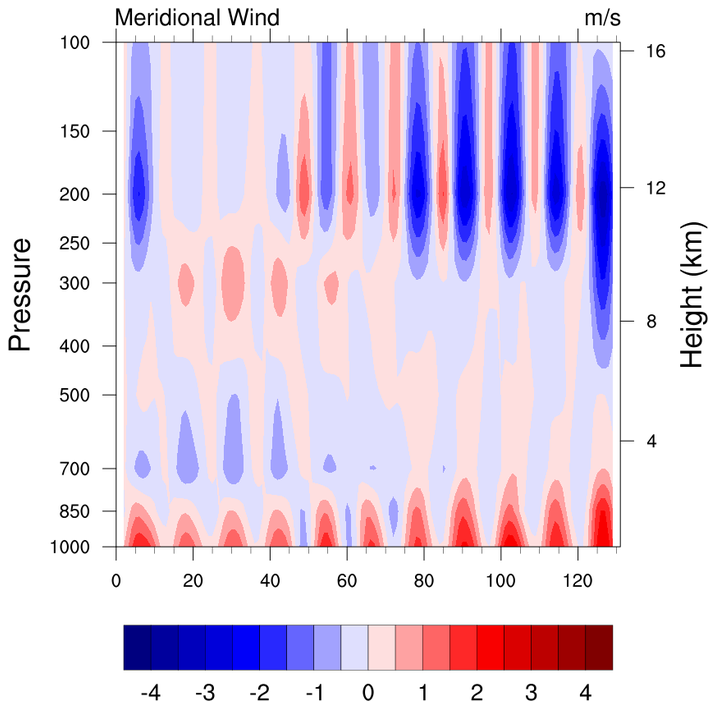
> In this example, the time goes from 0 to 120. Could we specify the tick
> marks with something else?
>
> Thanks,
>
> Yi
>
>
> _______________________________________________
> ncl-talk mailing list
> ncl-talk_at_ucar.edu
> http://mailman.ucar.edu/mailman/listinfo/ncl-talk
>
_______________________________________________
ncl-talk mailing list
ncl-talk_at_ucar.edu
http://mailman.ucar.edu/mailman/listinfo/ncl-talk
Received on Fri Jan 18 2008 - 09:48:25 MST
This archive was generated by hypermail 2.2.0 : Wed Jan 23 2008 - 14:19:33 MST