Hi,
I would like to have a depth axis looking like:
http://www.ncl.ucar.edu/Applications/Images/popslice_2_lg.png
or like from the script:
http://www.ncl.ucar.edu/Applications/Scripts/moc_2.ncl
using my data.
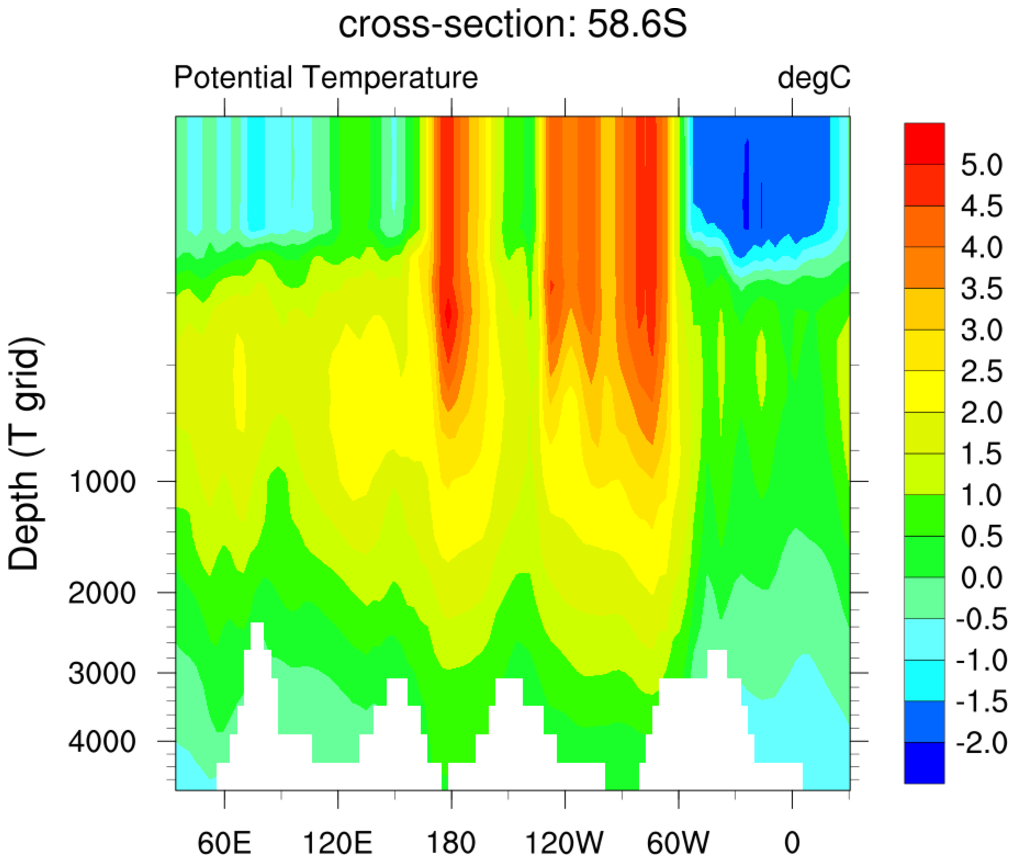
I have attached my data, script and current plot. I cannot see settings in moc_2.ncl
to set the upper ocean to be plotted over a large portion of the plots vertical extent?
Regards,
Mark.
_______________________________________________
ncl-talk mailing list
List instructions, subscriber options, unsubscribe:
http://mailman.ucar.edu/mailman/listinfo/ncl-talk
This archive was generated by hypermail 2.2.0 : Tue May 26 2009 - 10:17:16 MDT