Hello group.
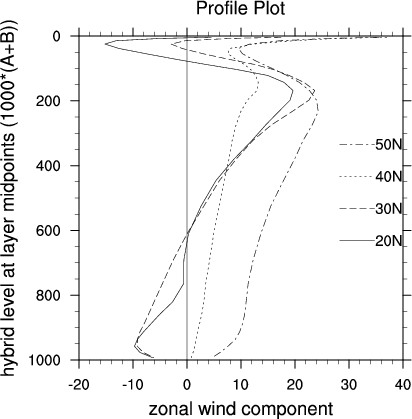
I'm curious if there is a way to fill the area between curves in a xy
profile plot, where I've switched the x and y axes as in example 16 in
the xy plots section of the application examples: http://www.ncl.ucar.edu/Applications/Images/xy_16_lg.png
It appears that in this case I cannot use the resource
gsnXYFillColors, since the x variable is now a multi-dimensional array.
Thanks in advance for any advice.
Ryan
Ryan L. Sriver
NOAA C&GC Postdoctoral Fellow
Department of Meteorology
The Pennsylvania State University
http://roskilde.eas.purdue.edu/~rsriver
_______________________________________________
ncl-talk mailing list
List instructions, subscriber options, unsubscribe:
http://mailman.ucar.edu/mailman/listinfo/ncl-talk
Received on Thu Dec 3 13:46:07 2009
This archive was generated by hypermail 2.1.8 : Mon Dec 07 2009 - 16:12:30 MST