Date: Fri Feb 05 2010 - 11:28:55 MST
Hi Guangshan,
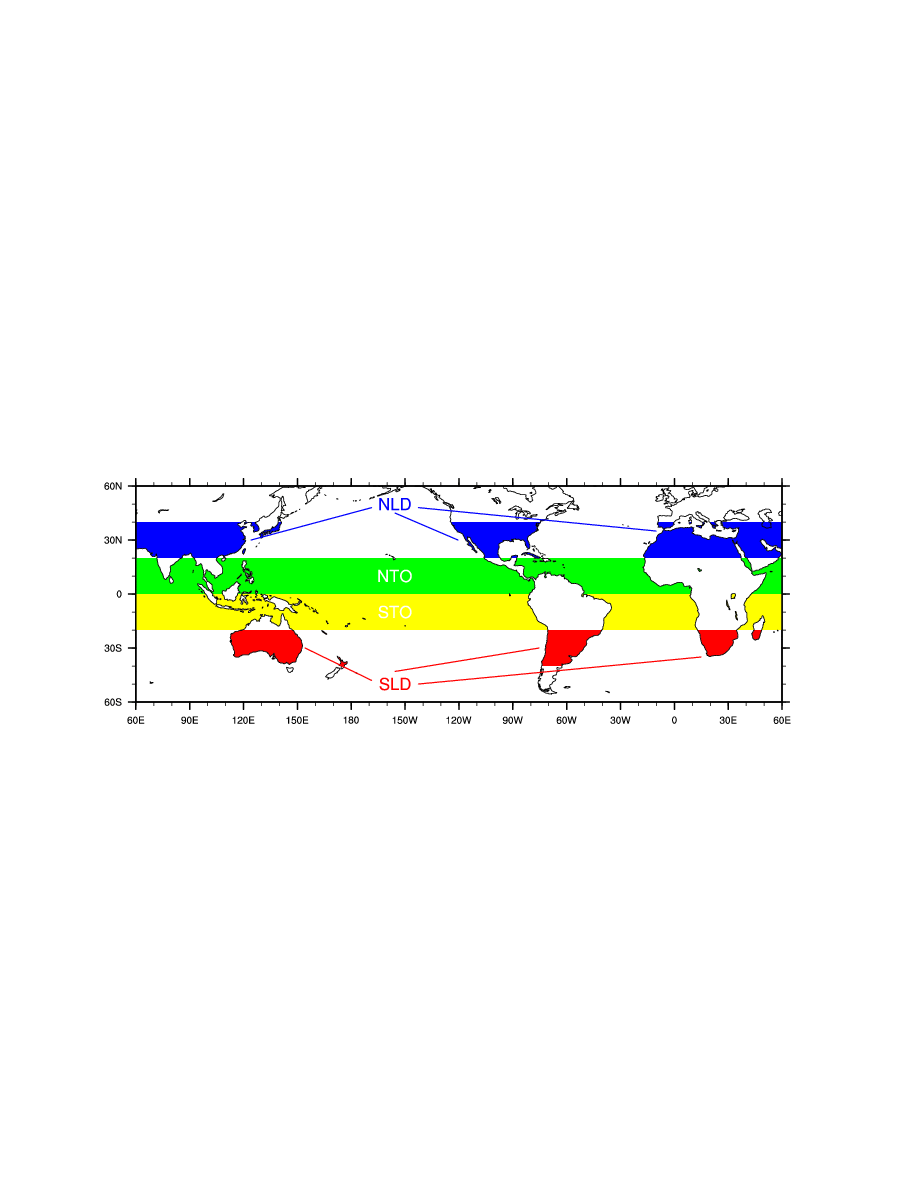
This isn't easy, primarily because the oceans need to be drawn over the
extratropical polygons, while the land has to be drawn over the tropical
polygons. This results in the need to draw 2 plots, with a tropical
strip plot overlaying a 60S-60N plot. Possible, but tedious. I've
attached a script and its' corresponding plot.
One word of note regarding using tfPolyDrawOrder: In the upcoming
version of NCL you can simply set this in your polygon resource list.
Previous versions of NCL require you to use setvalues, as is illustrated
in the script.
Adam
On 02/04/2010 09:27 PM, guangshan chen wrote:
> Dear all,
>
> Has anybody done this kind of plot before using NCL? Can you share your script with me? or any suggestions?
>
> Thanks in advance.
>
> Guangshan
>
>
>
>
> _______________________________________________
> ncl-talk mailing list
> List instructions, subscriber options, unsubscribe:
> http://mailman.ucar.edu/mailman/listinfo/ncl-talk
--
__________________________________________________
Adam Phillips
asphilli@ucar.edu
National Center for Atmospheric Research   tel: (303) 497-1726
Climate and Global Dynamics Division         fax: (303) 497-1333
P.O. Box 3000
Boulder, CO 80307-3000    http://www.cgd.ucar.edu/cas/asphilli
load "$NCARG_ROOT/lib/ncarg/nclscripts/csm/gsn_code.ncl"
load "$NCARG_ROOT/lib/ncarg/nclscripts/csm/gsn_csm.ncl"
begin
wks = gsn_open_wks("ps",get_script_prefix_name()) ; open a ps file
res = True
res@mpMaxLatF = 60.
res@mpMinLatF = -60
; res@vpYF = 0.8 ; not needed.
; res@vpXF = 0.1
; res@vpWidthF = 0.8
; res@vpHeightF = 0.4
res@mpCenterLonF = 240.
res@gsnDraw = False
res@gsnFrame = False
res@mpFillOn = True
res@mpFillColors = (/-1,0,-1,-1/)
res@mpOutlineOn = True
plot = gsn_csm_map_ce(wks,res) ; draw global map
xpts = (/360.0, 0.0,0.0, 360.0,360.0/)
ypts = (/ 20.0, 20.0, 40.0, 40.0, 20.0/)
resp = True
resp@gsFillColor = "blue"
; After V5.1.1, you can set this resource as part of the "resp" resource list.
setvalues plot
"tfPolyDrawOrder" : "Draw"
end setvalues
; resp@tfPolyDrawOrder = "Draw" ; default is "PostDraw"
dum = gsn_add_polygon(wks,plot,xpts,ypts,resp)
ypts = (/ -20.0, -20.0, -40.0, -40.0, -20.0/)
resp@gsFillColor = "red"
dum2 = gsn_add_polygon(wks,plot,xpts,ypts,resp)
draw(plot)
;---------------------------------------------------------
; Draw tropical plot, along with green/yellow polygons
;---------------------------------------------------------
res@mpMaxLatF = 20.
res@mpMinLatF = -20
res@tmXBOn = False
res@tmXTOn = False
res@tmXTBorderOn = False
res@tmXBBorderOn = False
res@tmXBLabelsOn = False
res@tmYLBorderOn = False
res@tmYRBorderOn = False
res@tmYLLabelsOn = False
res@tmYLOn = False
res@tmYROn = False
res@mpFillColors = (/-1,-1,0,-1/)
plot2 = gsn_csm_map_ce(wks,res) ; draw global map
resp@gsFillColor = "green"
; After V5.1.1, you can set this resource as part of the "resp" resource list.
setvalues plot2
"tfPolyDrawOrder" : "Draw"
end setvalues
; resp@tfPolyDrawOrder = "Draw" ; default is "PostDraw"
ypts = (/ 20.0, 20.0, 0.0, 0.0, 20.0/)
dum3 = gsn_add_polygon(wks,plot2,xpts,ypts,resp)
ypts = (/ -20.0, -20.0, 0.0, 0.0, -20.0/)
resp@gsFillColor = "yellow"
dum4 = gsn_add_polygon(wks,plot2,xpts,ypts,resp)
draw(plot2)
;-------------------------------------------------
; Draw map border, to cover up poylgon fills
;-------------------------------------------------
res@mpFillColors = (/-1,-1,-1,-1/)
res@tmXTBorderOn = True
res@tmXBBorderOn = True
res@tmYLBorderOn = True
res@tmYRBorderOn = True
res@mpMaxLatF = 60.
res@mpMinLatF = -60
res@mpOutlineOn = False
plot3 = gsn_csm_map_ce(wks,res) ; draw global map
;-------------------------------------------------
; Draw text
;-------------------------------------------------
sres = True
sres@txFontHeightF = 0.015
sres@txFontColor = "blue"
dum5 = gsn_add_text(wks,plot3,"NLD",205,50,sres)
sres@txFontColor = "white"
dum6 = gsn_add_text(wks,plot3,"NTO",205,10,sres)
dum7 = gsn_add_text(wks,plot3,"STO",205,-10,sres)
sres@txFontColor = "red"
dum8 = gsn_add_text(wks,plot3,"SLD",205,-50,sres)
;-------------------------------------------------
; Draw lines
;-------------------------------------------------
pres = True
pres@gsLineColor = "blue"
pres@gsLineThicknessF = 1.5
dum9 = gsn_add_polyline(wks,plot3,(/192,125/),(/48,30/),pres)
dum10 = gsn_add_polyline(wks,plot3,(/205,240/),(/45,30/),pres)
dum11 = gsn_add_polyline(wks,plot3,(/218,350/),(/48,35/),pres)
pres@gsLineColor = "red"
dum12 = gsn_add_polyline(wks,plot3,(/192,155/),(/-48,-30/),pres)
dum13 = gsn_add_polyline(wks,plot3,(/205,285/),(/-43,-30/),pres)
dum14 = gsn_add_polyline(wks,plot3,(/218,375/),(/-50,-35/),pres)
draw(plot3)
frame(wks)
end
_______________________________________________
ncl-talk mailing list
List instructions, subscriber options, unsubscribe:
http://mailman.ucar.edu/mailman/listinfo/ncl-talk
