Dear all:
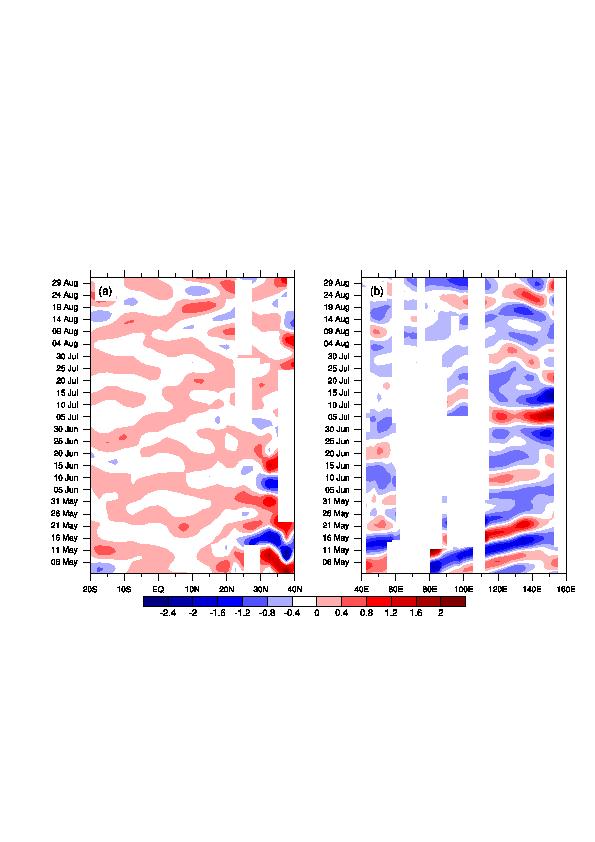
When I plot the Time-Latitude and Time-Longitude cross sections in terms of the filtered data, there seems somethig wrong in the figtures, in which there seems some values missed. But when I use the script to deal with other data, the result is right. BTW, both of the data is correct. The script is as follows:
load "$NCARG_ROOT/lib/ncarg/nclscripts/csm/gsn_code.ncl"
load "$NCARG_ROOT/lib/ncarg/nclscripts/csm/gsn_csm.ncl"
load "$NCARG_ROOT/lib/ncarg/nclscripts/csm/contributed.ncl"
begin
path="$HOME/1998/data/"
filename1="pv.1998.nc"
filename2="air.1998.nc"
filename3="olr.nc"
f1 = addfile(path+filename1,"r")
f2 = addfile(path+filename2,"r")
f3 = addfile(path+filename3,"r")
pv = f1->pv
pv&time = f3->olr&time
T = short2flt(f2->air)
T&time = pv&time
lev = f2->level
;***********************************************************
; Calculate potential temperature at each level aat all grid points
;***********************************************************
ph = T
do i=0,(dimsizes(lev)-1)
ph(:,i,:,:) = lev(i)
end do
ph@long_name="pressure"
ph@units="hPa"
theta = T ; create/transfer meta data
theta = T*(1000/ph)^0.286 ; calculate potential temperature
;***********************************************************
; User specified isentropic levels
;***********************************************************
lvl = ispan(315,380,5)*1. ; specify desired isentropic levels
;**********************************************************
; use int2p to interpolate: This operates on the rightmost
; dimension so use named dimensions to reorder
;*********************************************************
pvlvl = 1e4*int2p (theta(time|:,lat|:,lon|:,level|:), \
pv(time|:,lat|:,lon|:,lev|:), lvl, 0)
pvlvl!0 = "time" ; name dimensions
pvlvl!1 = "lat"
pvlvl!2 = "lon"
pvlvl!3 = "lvl"
pvlvl&time = pv&time ; assign coordinates
pvlvl&lvl = lvl ; isentropic levels
pvlvl&lat = pv&lat
pvlvl&lon = pv&lon
pvlvl@long_name = "Potential Vorticity" ; attributes
pvlvl@units = "PVU"
printVarSummary(pvlvl)
; ***********************************************
; create the filter weights and apply
; ***********************************************
IP = pvlvl(time|:,{lvl|370},lat|:, lon|:)
ihp = 2 ; band pass
sigma = 1.0 ; Lanczos sigma
nWgt = 51 ; loose 100 each end
dt = 1.0
t1 = 30.0
t2 = 10.0
fca = dt/t1 ; start freq
fcb = dt/t2 ; last freq
wgt = filwgts_lanczos (nWgt, ihp, fca, fcb, sigma )
xBPF = wgt_runave ( IP(lat|:,lon|:,time|:), wgt, 0 ) ; 30-60 day
xBPF!0 = "lat"
xBPF!1 = "lon"
xBPF!2 = "time"
xBPF&lat = IP&lat
xBPF&lon = IP&lon
xBPF&time = IP&time
; printVarSummary(xBPF)
x1 = dim_avg_n_Wrap(xBPF(:,{50:80},:),1)
x2 = dim_avg_n_Wrap(xBPF({25:30},:,:),0)
; ***********************************************
; create new date array for use on the plot
; ***********************************************
month_abbr = (/"","Jan","Feb","Mar","Apr","May","Jun","Jul","Aug","Sep", \
"Oct","Nov","Dec"/)
utc_date = ut_calendar(x1&time, 0)
month = floattointeger(utc_date(:,1))
day = floattointeger(utc_date(:,2))
date_str = sprinti("%0.2i ", day)+month_abbr(month)
; **************************************************
wks = gsn_open_wks ("x11","pv-filters")
gsn_define_colormap(wks,"BlWhRe") ; choose colormap
res = True ; plot mods desired
res@gsnDraw = False ; don't draw
res@gsnFrame = False ; don't advance frame yet
res@vpHeightF = 0.65 ; change aspect ratio of plot
res@vpWidthF = 0.45
res@tmYLMode = "Explicit"
res@tmYLValues = ispan(120,242,5)
res@tmYLLabels = date_str(120:242:5)
res@tmYROn = False
res@tmXBMode = "Explicit"
res@tmXBValues = ispan(-20,40,10)
res@tmXBLabels = (/"20S","10S","EQ","10N","20N","30N","40N"/)
res@tmXBMinorValues=ispan(-20,40,5)
res@tmXBLabelFontHeightF=0.013
res@tmYLLabelFontHeightF=0.013
res@lbLabelBarOn = False ; turn off individual cb's
res@lbOrientation = "vertical" ; vertical label bar
res@cnFillOn = True
res@cnLinesOn = False
res@cnLineLabelsOn = False ; no lables on line
res@cnInfoLabelOn = False ; turn off info label box
res@gsnSpreadColors = True
plot=new(2,"graphic")
xx=x1(time|:,lat|:)
xx1=x2(time|:,lon|:)
plot(0) = gsn_csm_time_lat(wks,xx(120:242,{-20:40}),res)
res@tmXBMode = "Explicit"
res@tmXBValues = ispan(40,160,20)
res@tmXBLabels = (/"40E","60E","80E","100E","120E","140E","160E"/)
res@tmXBMinorValues=ispan(40,160,10)
plot(1) = gsn_csm_hov(wks,xx1(120:242,{40:160}),res)
resP = True
resP@gsnMaximize = True
resP@gsnPaperOrientation="portrait"
resP@gsnPanelFigureStringsPerimOn=False
resP@amJust=(/"TopLeft"/)
resP@gsnPanelFigureStringsFontHeightF=0.015
resP@gsnPanelFigureStrings=(/"(a)","(b)"/)
resP@gsnPanelFigureStringsPerimOn=False
resP@gsnPanelLabelBar = True ; add common colorbar
resP@lbAutoManage = False ; we control label bar
resP@lbOrientation = "horizontal" ; horizontal/vertical label bar
resP@pmLabelBarOrthogonalPosF = 0.01 ; move label bar closer
;resP@pmLabelBarSide = "right" ; default is right
resP@lbLabelStride = 1 ; skip every other label
resP@pmLabelBarWidthF = 0.6 ; default is shorter
resP@pmLabelBarHeightF = 0.06 ; default is taller
resP@lbLabelFontHeightF = .0125 ; default is HUGE
resP@lbPerimOn = False ; default has box
gsn_panel(wks,plot,(/1,2/),resP)
end
Best wishes.
2010-04-08
lbqnj
_______________________________________________
ncl-talk mailing list
List instructions, subscriber options, unsubscribe:
http://mailman.ucar.edu/mailman/listinfo/ncl-talk
This archive was generated by hypermail 2.1.8 : Fri Apr 23 2010 - 14:40:07 MDT