Date: Thu Jun 17 2010 - 20:29:53 MDT
Hi Mary,
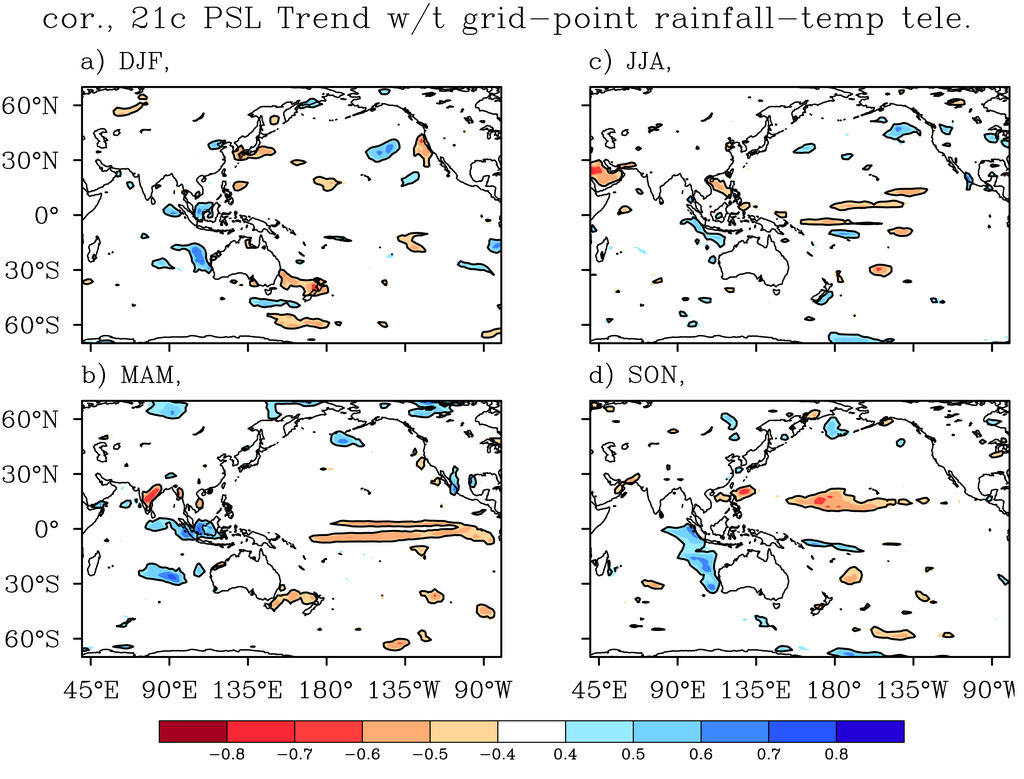
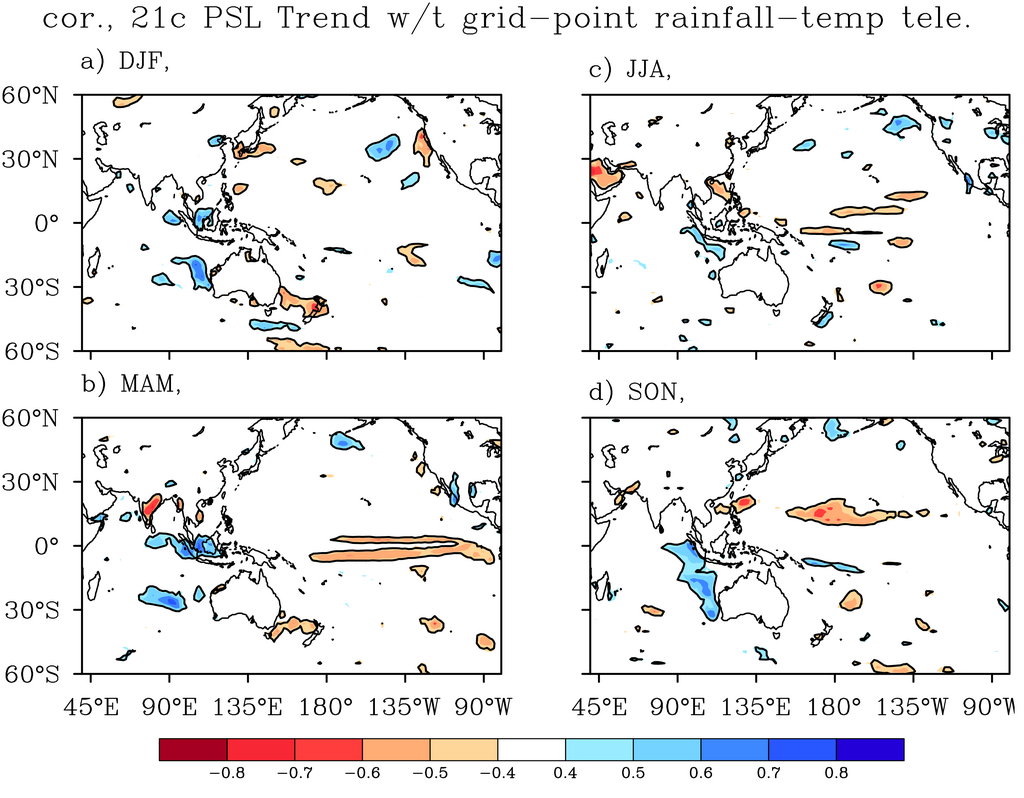
Thanks for your reply. Attached with two plot one both using same codes but only mpMinLatF and mpMaxLatF are different. As you could see that the labels are in different height.
Cheers,
Arnold
________________________________
From: Mary Haley [mailto:haley@ucar.edu]
Sent: Friday, 18 June 2010 1:34 AM
To: Sullivan, Arnold (CMAR, Aspendale)
Cc: ncl-talk@ucar.edu
Subject: Re: NCL 5.1.1 Font problems
On Jun 16, 2010, at 6:49 PM, <Arnold.Sullivan@csiro.au<mailto:Arnold.Sullivan@csiro.au>> <Arnold.Sullivan@csiro.au<mailto:Arnold.Sullivan@csiro.au>> wrote:
Dear all,
1st problem:
Try to generate 2 by 2 panel plot:
plot = new(4, graphic)
...............
res_at_mpMinLonF<x-msg://1527/res_at_mpMinLonF> = 0. ; select a subregion
res@mpMaxLonF<mailto:res@mpMaxLonF> = 360.
res@mpMinLatF<mailto:res@mpMinLatF> = -70.
res@mpMaxLatF<mailto:res@mpMaxLatF> = 70.
................
res@gsnLeftString<mailto:res@gsnLeftString> = "a) DJF,"
res@gsnLeftString<mailto:res@gsnLeftString> = "b) DJF,"
res@gsnLeftString<mailto:res@gsnLeftString> = "c) DJF,"
res@gsnLeftString<mailto:res@gsnLeftString> = "d) DJF,"
................
gsn_panel(wks,plot,(/2,2/),res_P) ; now draw as right panel.
If I use such code the plot looks ok. However, if I change MinLatF and MaxLatF to -60 and 60, a) and c) string possition will be higher then b) and d).
Hi Arnold,
I'm afraid I don't have enough information to go on here. Can you provide an image that shows the two different versions?
The only thing that I can think of is that when you change the limits of your plot, this changes the size of your plot, and
in turn, the titles may have to be shrunk in order to stay with the plot.
Also, if your four plots do not have the exact same plot limits, this can cause differences in your titles. If I can
see the images, then I might know better how to fix it.
2nd problem:
Similar plot but 3 by 4 panel plot:
; ===============================
; overlay plots
; ===============================
res_L@tmYLLabelsOn<mailto:res_L@tmYLLabelsOn> = True
res_L@gsnLeftStringParallelPosF<mailto:res_L@gsnLeftStringParallelPosF> = 0 ; move this string left or right
res_L@gsnLeftStringOrthogonalPosF<mailto:res_L@gsnLeftStringOrthogonalPosF> = .05 ; move this string up or down
res_L@gsnLeftString<mailto:res_L@gsnLeftString> = "a) DJF cor. b/t 21st TPC & 20th IOD tele"
plot_L(0) = gsn_csm_contour_map_overlay(wks,CORREL(0,:,:), CORREL(0,:,:), res_L, res_cor)
res_L@gsnLeftString<mailto:res_L@gsnLeftString> = "b) DJF cor. b/t 21st TPC & 20th IOD reg."
plot_L(1) = gsn_csm_contour_map_overlay(wks,SLOPE(0,:,:), SLOPE(0,:,:), res_L, res_cor)
res_L@tmXBLabelsOn<mailto:res_L@tmXBLabelsOn> = True
res_L@gsnLeftString<mailto:res_L@gsnLeftString> = "c) DJF cor. b/t 21st TPC & 20th IOD SNR."
plot_L(2) = gsn_csm_contour_map_overlay(wks,STONR(0,:,:), STONR(0,:,:), res_L, res_cor)
; ======================
; Center Left
; ======================
res_CL@gsnLeftStringParallelPosF<mailto:res_CL@gsnLeftStringParallelPosF> = 0 ; move this string left or right
res_CL@gsnLeftStringOrthogonalPosF<mailto:res_CL@gsnLeftStringOrthogonalPosF> = .05 ; move this string up or down
res_CL@gsnLeftString<mailto:res_CL@gsnLeftString> = "d) MAM cor. b/t 21st TPC & 20th IOD tele."
plot_CL(0) = gsn_csm_contour_map_overlay(wks,CORREL(1,:,:),CORREL(1,:,:), res_CL, res_cor)
res_CL@gsnLeftString<mailto:res_CL@gsnLeftString> = "e) MAM cor. b/t 21st TPC & 20th IOD reg."
plot_CL(1) = gsn_csm_contour_map_overlay(wks,SLOPE(1,:,:),SLOPE(1,:,:), res_CL, res_cor)
res_CL@tmXBLabelsOn<mailto:res_CL@tmXBLabelsOn> = True
res_CL@gsnLeftString<mailto:res_CL@gsnLeftString> = "f) MAM cor. b/t 21st TPC & 20th IOD SNR."
plot_CL(2) = gsn_csm_contour_map_overlay(wks,STONR(1,:,:),STONR(1,:,:), res_CL, res_cor)
; ======================
; Center Right
; ======================
res_CR@gsnLeftStringParallelPosF<mailto:res_CR@gsnLeftStringParallelPosF> = 0 ; move this string left or right
res_CR@gsnLeftStringOrthogonalPosF<mailto:res_CR@gsnLeftStringOrthogonalPosF> = .05 ; move this string up or down
res_CR@gsnLeftString<mailto:res_CR@gsnLeftString> = "g) JJA cor. b/t 21st TPC & 20th IOD tele."
plot_CR(0) = gsn_csm_contour_map_overlay(wks,CORREL(2,:,:),CORREL(2,:,:), res_CR, res_cor)
res_CR@gsnLeftString<mailto:res_CR@gsnLeftString> = "h) JJA cor. b/t 21st TPC & 20th IOD reg."
plot_CR(1) = gsn_csm_contour_map_overlay(wks,SLOPE(2,:,:),SLOPE(2,:,:), res_CR, res_cor)
res_CR@tmXBLabelsOn<mailto:res_CR@tmXBLabelsOn> = True
res_CR@gsnLeftString<mailto:res_CR@gsnLeftString> = "i) JJA cor. b/t 21st TPC & 20th IOD SNR."
plot_CR(2) = gsn_csm_contour_map_overlay(wks,STONR(2,:,:),STONR(2,:,:), res_CR, res_cor)
; ======================
; Right
; ======================
res_R@gsnLeftStringParallelPosF<mailto:res_R@gsnLeftStringParallelPosF> = 0 ; move this string left or right
res_R@gsnLeftStringOrthogonalPosF<mailto:res_R@gsnLeftStringOrthogonalPosF> = .05 ; move this string up or down
res_R@gsnLeftString<mailto:res_R@gsnLeftString> = "i) SON cor. b/t 21st TPC & 20th IOD tele."
plot_R(0) = gsn_csm_contour_map_overlay(wks,CORREL(3,:,:),CORREL(3,:,:), res_R, res_cor)
res_R@gsnLeftString<mailto:res_R@gsnLeftString> = "j) SON cor. b/t 21st TPC & 20th IOD reg."
plot_R(1) = gsn_csm_contour_map_overlay(wks,SLOPE(3,:,:),SLOPE(3,:,:), res_R, res_cor)
res_R@tmXBLabelsOn<mailto:res_R@tmXBLabelsOn> = True
res_R@gsnLeftString<mailto:res_R@gsnLeftString> = "l) SON cor. b/t 21st TPC & 20th IOD SNR."
plot_R(2) = gsn_csm_contour_map_overlay(wks,STONR(3,:,:),STONR(3,:,:), res_R, res_cor)
If I change "a) DJF cor. b/t 21st TPC & 20th IOD tele" to "a) DJF cor. b/t 21st TPC & 20th IOD tele." then won't plot that panel and get error message:
I think here you might be running into a problem with the length of your title relative to the size of your
plot. In this case, seeing an image will help, but I may need to follow up after that by asking for your data
and full script.
Thanks,
--Mary
fatal:MapV40DHDrawMapList: ARPRAM - ALGORITHM FAILURE
fatal:PlotManagerDraw: error in plot draw
fatal:_NhlPlotManagerDraw: Draw error
Regards,
Arnold Sullivan
Scientist Support
CSIRO Marine & Atmospheric Research
Ph: 61 03 9239 4525
Fax: 61 03 9239 4444
Email: arnold.sullivan@csiro.au<mailto:arnold.sullivan@csiro.au>
_______________________________________________
ncl-talk mailing list
List instructions, subscriber options, unsubscribe:
http://mailman.ucar.edu/mailman/listinfo/ncl-talk