Date: Thu Jul 15 2010 - 11:07:49 MDT
Hello all,
I've searched the archives & examples and haven't found an example of a
common label bar for a panel plot composed of vectors overlaid on a
field, where the label bar matches the field. If you know of such an
example, please send it my way! Otherwise here is my question:
I am creating plots of a field overlaid with wind vectors via:
plot= gsn_csm_vector_scalar_map_polar(wks,u,v,var,res)
These are arranged in a panel plot, one panel for each season, eg:
res = True
res@gsnDraw = False ; don't draw
res@gsnFrame = False ; don't advance frame
res@gsnPolar = "NH" ; specify the hemisphere
gsn_define_colormap(wks,"wgne15")
res@mpMinLatF = 30
res@mpFillOn = False
res@cnFillOn = True ; color fill
res@cnLevelSpacingF = 3. ; interval spacing
res@cnLinesOn = False ; no contour lines
res@gsnScalarContour = True ; vectors over scalars
res@vcRefMagnitudeF = 20.0 ; vec magnitude
res@vcRefLengthF = 0.04 ; size of ref vector
res@vcLineArrowColor = "white" ; white vectors
res@vcMinDistanceF = 0.02 ; thins arrows near pole
res@vcGlyphStyle = "CurlyVector" ; turns on curley vectors
res@vcRefAnnoArrowLineColor = "black" ; black ref vector
res@vcRefAnnoArrowUseVecColor = False
res@gsnSpreadColors = True ; use full colormap
res@gsnSpreadColorStart = 2
res@gsnSpreadColorEnd = -3
res@cnLevelSelectionMode = "ManualLevels" ; set manual contour
levels
res@cnMinLevelValF = 0 ; set min contour level
res@cnMaxLevelValF = 20 ; set max contour level
res@cnLevelSpacingF = 2. ; set contour spacing
res@lbLabelBarOn = False
plot(0)= gsn_csm_vector_scalar_map_polar(wks,u,v,varDJF,res)
plot(1)= gsn_csm_vector_scalar_map_polar(wks,u,v,varMAM,res)
plot(2)= gsn_csm_vector_scalar_map_polar(wks,u,v,varJJA,res)
plot(3)= gsn_csm_vector_scalar_map_polar(wks,u,v,varSON,res)
resP = True ; modify the panel plot
resP@gsnPanelLabelBar = True ; add common colorbar
resP@lbTitleString ="kg/m2/s"
resP@lbTitlePosition="Bottom"
resP@lbAutoManage = False
resP@lbTitleFontHeightF= 0.010
resP@lbLabelFontHeightF= 0.01
resP@txString = VAR+" NAO+ composite"
gsn_panel(wks,plot,(/2,2/),resP) ; now draw as one plot
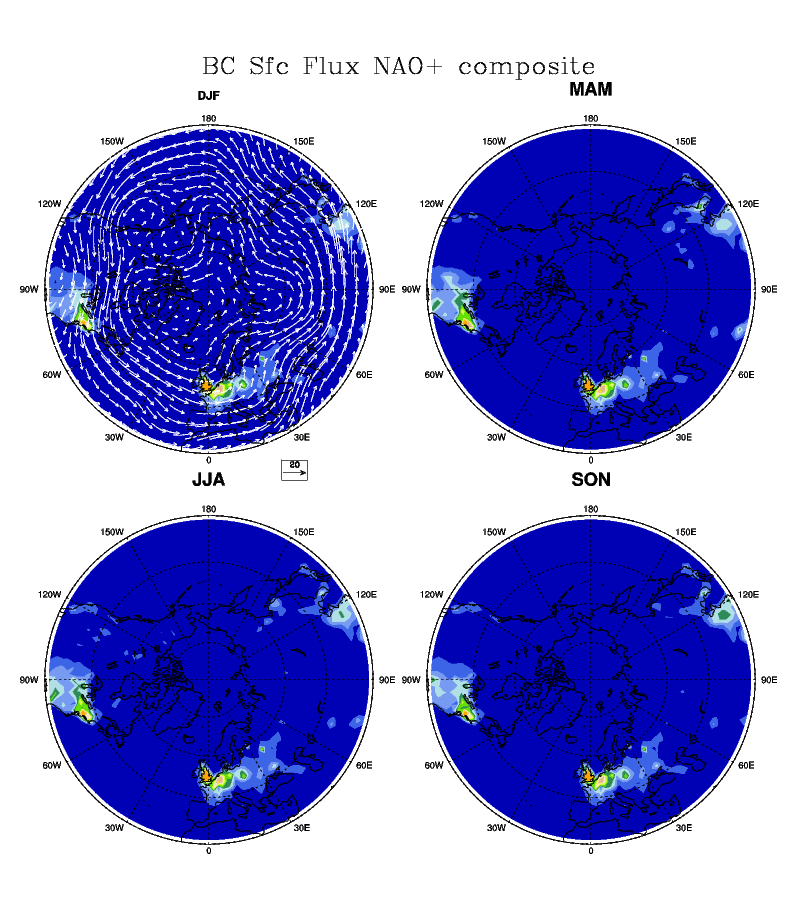
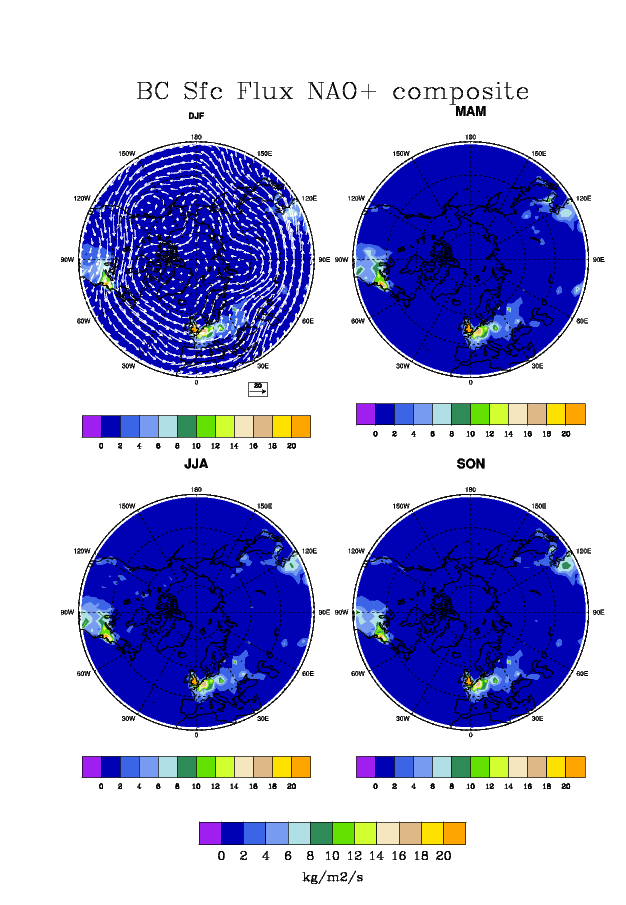
Here is the problem: If res@lbLabelBarOn = False then there
will be no common label bar, even though resP@gsnPanelLabelBar =
True . Yet if res@lbLabelBarOn = True and resP@gsnPanelLabelBar
= True , each individual plot has its own label bar (expected) and
suddenly there is a common label bar, too! What's going on here? I
suspect the gsnPanelLabelBar resource doesn't know whether to make a
label bar for the vectors or the colored contours (since this problem
only appears when the overlaid vectors are included). Interestingly,
even if only one of the 4 plots has vectors, the problem appears. Please
see attached images to see what I'm talking about.
Has anyone else encountered this problem before? Any ideas how to fix it?
Thanks in advance. I'm a summer student, new to NCL, and I really
appreciate the help.
Cheers,
Eowyn
_______________________________________________
ncl-talk mailing list
List instructions, subscriber options, unsubscribe:
http://mailman.ucar.edu/mailman/listinfo/ncl-talk