Date: Fri Jan 07 2011 - 09:45:02 MST
Hello
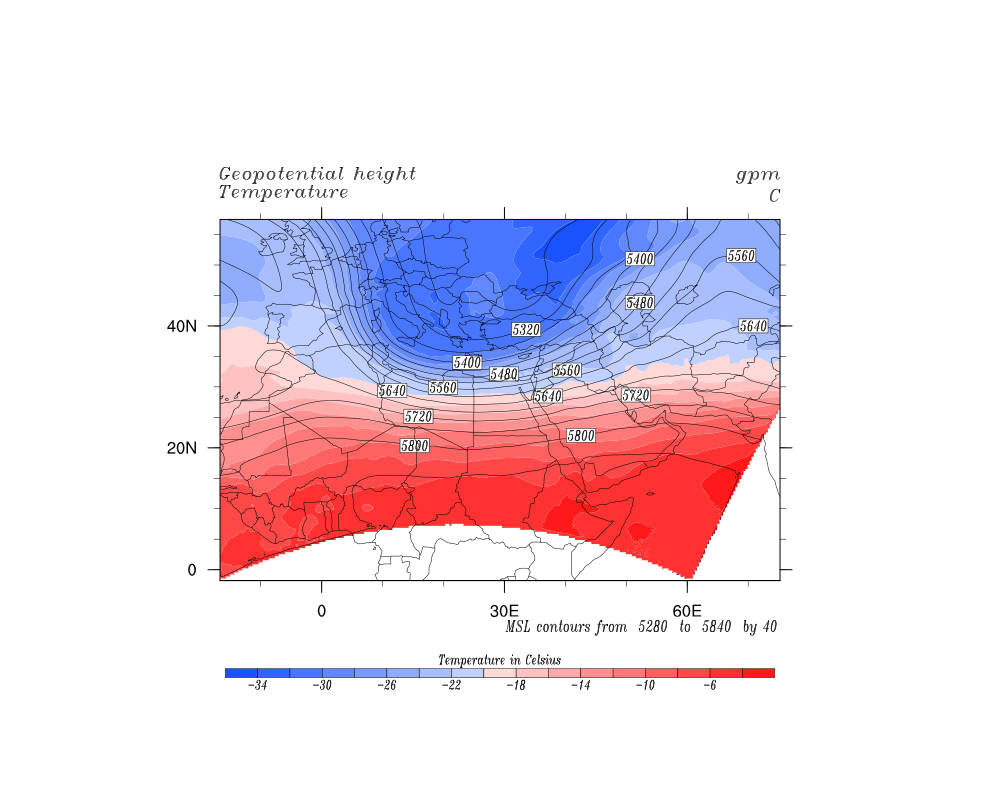
I am trying to plot a rotated lat lon grib file , but at southeast and south
the image is squeezed , i have used the native grid and also the corner
resource limit mode to adjust the corners but the problem still exist.
the code and the output are attached .
*load "$NCARG_ROOT/lib/ncarg/nclscripts/csm/gsn_code.ncl"*
*load "$NCARG_ROOT/lib/ncarg/nclscripts/csm/gsn_csm.ncl"*
*begin*
*;**************************************************************
*;=========>>>>>>>>> Open file and get variables.*
*dir = "../../../data/wrf_10111200/"*
*f1 = addfile(dir + "10121100.GrbF153.grb","r") ;opening the file*
*geo = f1->HGT_GDS0_ISBL_10(:,:,:) ;reading the geopotential height at
all levels(gpm)*
*t = f1->TMP_GDS0_ISBL_10(:,:,:) ;reading the temperature at all
levels (K)*
*u = f1->U_GRD_GDS0_ISBL_10(:,:,:) ;reading the u-wind at all levels
(m/s^2) *
*v = f1->V_GRD_GDS0_ISBL_10(:,:,:) ;reading the v-wind at all levels
(m/s^2)*
*lat = f1->g0_lat_0(:) ;reading the latitude*
*lon = f1->g0_lon_1(:) ;reading the longitude*
*lev = f1->lv_ISBL3(:)*
*
*
*t=t-273.15 ;Converting from kelvin to celsius*
*;*************printing some information****************************
*;print("these are the levels")*
*;print(lev)*
*print ("at level "+lev(9)+"mb==> min(T)="+min(t(9,:,:))+",
max(T)="+max(t(9,:,:)) )*
*;************opening the workstation********************************
*wks = gsn_open_wks("png" ,"../output/upper") ; ps,pdf,x11,ncgm,eps
*
*gsn_define_colormap(wks,"BlueRed") ; choose color map*
*;gsn_reverse_colormap(wks)*
*;gsn_draw_colormap(wks)*
*;***************************************************************
*;*************************************************************
*;=========>>>>>>>gsn_csm_map*
*resm = True*
*resm@tfDoNDCOverlay = True ; do not transform
data(native grid)*
*resm@mpProjection = "CylindricalEquidistant"*
*resm@mpLimitMode = "Corners"*
*resm@mpLeftCornerLatF = min(lat)*
*resm@mpLeftCornerLonF = min(lon)*
*resm@mpRightCornerLatF = max(lat) *
*resm@mpRightCornerLonF = max(lon)*
*resm@mpOutlineOn = True ; enables the map
area outline *
*resm@mpOutlineBoundarySets = "AllBoundaries" ; turn on country
boundaries*
*resm@mpGeophysicalLineColor = "black" ;color of cont.
outlines*
*resm@mpGeophysicalLineThicknessF = 1. ;double the
thickness of geophysical boundaries*
*resm@mpNationalLineThicknessF = 1. ;double the
thickness of national boundaries*
*resm@mpFillOn = False*
*;resm@vpWidthF = 1.0 ;width of the image*
*;resm@vpHeightF = 1.0 ;Height of the image*
*;resm@mpGridAndLimbOn =True*
*resm@gsnDraw = False ;do not draw the
plot*
*resm@gsnFrame = False ;do not advance
the frame*
*plot_m = gsn_csm_map(wks,resm)*
*;*************************************************************
*;************************************************************
*;========>>>>>>gsn_csm_contour geopotential height*
*resc = True*
*resc@cnMaxLevelValF = max(geo(9,:,:))*
*resc@cnMinLevelValF = min(geo(9,:,:))*
*;;;;Line or shaded contour *
*resc@cnFillOn = False*
*resc@cnLinesOn = True *
*;;;;;properties of the lines *
*resc@cnLineThicknessF = 1*
*resc@cnLineColor = "black"*
*;;;;;Titles*
*resc@tiMainFont ="triplex_italic"*
*resc@gsnStringFont ="triplex_italic"*
*resc@gsnRightString = geo@units ;right
string*
*resc@gsnLeftString = geo@long_name ;left
string*
*resc@gsnCenterString = ""*
*resc@gsnLeftStringOrthogonalPosF = 0.1 ;left string vertical pos*
*resc@gsnRightStringOrthogonalPosF = 0.1 ;right string vertical pos
*
*;;;;;infolabel*
*resc@cnInfoLabelString = "MSL contours from $CMN$ to $CMX$
by $CIU$"*
*resc@cnInfoLabelFontColor = "black" ;;red font color *
*resc@cnInfoLabelPerimOn = False ;;not to draw abox arount
information bar*
*resc@cnInfoLabelParallelPosF = 1.0 ;;position in x axis*
*resc@cnInfoLabelOrthogonalPosF = 0.1 ;;position in y axis*
*resc@cnInfoLabelFont = "triplex_italic"*
*resc@cnInfoLabelFontAspectF = 2*
*resc@cnInfoLabelFontHeightF = 0.012*
*;;;;;LineLabel*
*resc@cnLabelMasking = True ;; not to overlay the label
and contour line*
*resc@cnLineLabelAngleF = 0.0;make the labelline label
horizontal*
*resc@cnLineLabelFontColor = "black"*
*resc@cnLineLabelPerimOn = True ;; draw box around the label
*
*resc@cnLineLabelFont = "triplex_italic"*
*resc@cnLineLabelFontAspectF = 2*
*resc@cnLineLabelFontHeightF = 0.011*
*
*
*;;;;;Donot draw know*
*resc@gsnDraw = False ; do not draw the plot*
*resc@gsnFrame = False ; do not advance the
frame*
*plot_c=gsn_csm_contour(wks,geo(9,:,:),resc)*
*;*******************************************************************
*;=======>>>>>>gsn_csm_contour Temperature*
*rest = True*
*;;;;Line or shaded contour *
*rest@cnFillOn = True*
*rest@cnLinesOn = False*
*;;;;spreading the color*
*rest@gsnSpreadColors = True*
*;;;;;Titles*
*rest@tiMainFont ="triplex_italic"*
*rest@gsnStringFont ="triplex_italic"*
*rest@gsnRightString = "C" ;right
string*
*rest@gsnLeftString = t@long_name ;left
string*
*rest@gsnCenterString = ""*
*rest@gsnLeftStringOrthogonalPosF = 0.05 ;left string vertical pos
*
*rest@gsnRightStringOrthogonalPosF = 0.05 ;right string vertical
pos*
*;;;;label bar*
*rest@lbLabelsOn = True*
*rest@lbLabelStride = 2*
*rest@lbLabelFont = "triplex_italic" *
*rest@lbLabelFontAspectF = 2*
*rest@lbLabelFontHeightF = 0.01*
*rest@lbTopMarginF = 0.7 *
*rest@lbTitleOn = True*
*rest@lbTitleFont = "triplex_italic"*
*rest@lbTitleString = "Temperature in Celsius"*
*rest@lbTitleFontAspectF = 2*
*rest@lbTitleFontHeightF = 0.01 *
*;;Donot draw know*
*rest@gsnDraw = False ; do not draw the plot*
*rest@gsnFrame = False ; do not advance the
frame*
*plot_t=gsn_csm_contour(wks,t(9,:,:),rest)*
*;*******************************************************************
*;======>>>>>>> overlay all plots*
*overlay(plot_m,plot_t) ;; put the line contor(geopotential height) first*
*overlay(plot_m,plot_c) ;; put the shaded contour(the temperature) second*
*draw(plot_m)*
*frame(wks)*
*
*
*end*
--
===============
Ahmed Lasheen
Junior researcher at Cairo Numerical Weather Prediction Center (CNWPC)
Egyptian Meteorological Authority(EMA)
Cairo,Egypt
===============
_______________________________________________
ncl-talk mailing list
List instructions, subscriber options, unsubscribe:
http://mailman.ucar.edu/mailman/listinfo/ncl-talk
- application/octet-stream attachment: upper_air.ncl