I am trying to adjust my plot to look as similar as possible in style
to another plot (though the data itself is different). I am having
difficulty adjusting some of the features, such as the labelling of
the axes etc. Even though the style of my plot is now looking much
closer to what I want, there are some things that I cannot seem to
alter using any of the commands I have tried.
In particular I am having difficulties trying to :
1) Reverse the plot from top to bottom, so that values corresponding
to the largest pressures are at the bottom of the plot rather than
the top
2) Reverse the direction of the pressure values on the y axis, so
that the largest numbers are at the bottom of the plot
3) Change the values on the x-axis from the standard labelling to
labelling just -50, 0 , and 50
4) Change the values on the y-axis so the numbers are all multiplied
by 100 (so that the values really are in Pascals rather than mbar)
5) Move the numbers on the label bar from the right hand side to the
left hand side of the bar (and put the numbers right at the ends of
the bar)
6) Put black labels with numbers on some of the contours on the plot.
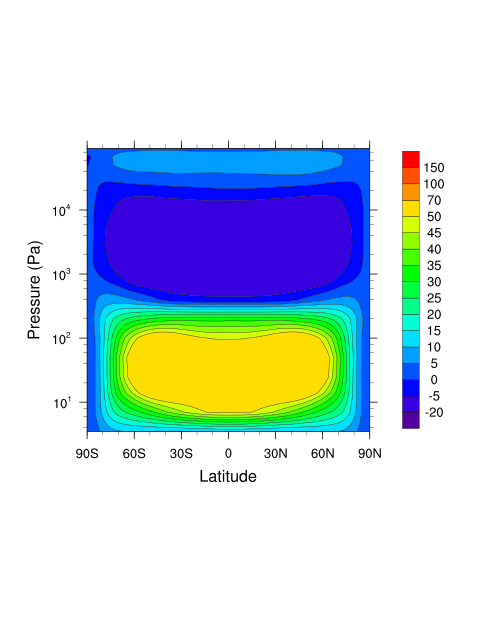
Plot A below is my current plot.
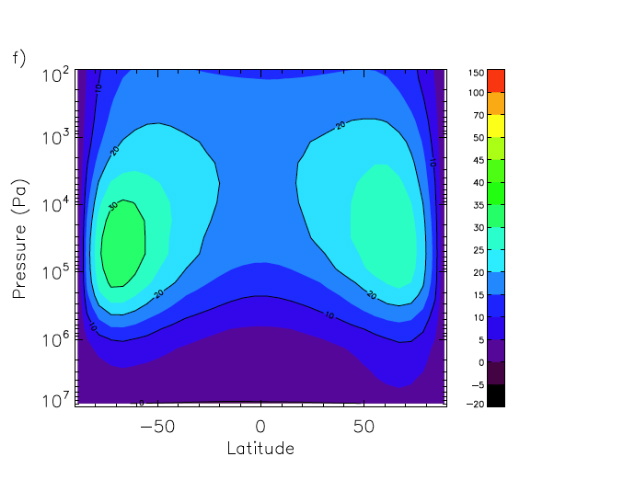
Plot B below is the style of plot I am trying to produce.
The text in C below is a copy of the current script I am using.
Does anyone have any ideas on how to adjust these features ?.
Thanks,
Helen.
A. My current plot, which I am trying to adjust:
B. The plot whose style I am trying to reproduce:
C. The script I am using to generate the plot in A.
;***********************
; timeavlatht.ncl
;***********************
load "$NCARG_ROOT/lib/ncarg/nclscripts/csm/gsn_code.ncl"
;load "$NCARG_ROOT/lib/ncarg/nclscripts/csm/gsn_csm.ncl"
load "/p/lscratchd/parish3/gsn_csm.ncl"
;***********************
load "$NCARG_ROOT/lib/ncarg/nclscripts/csm/contributed.ncl"
begin
diri = "./"
fili = systemfunc("cd "+diri+" ; ls zeusrand09125*.cam2.h0*nc")
print(fili)
nfili = dimsizes(fili)
lev_p = (/ 91500., 90000., 87500., 80000., 67500., 50000., 30000.,
20000., 10000., 5000., 3000., 1500., 750., 390., 200., 100., 50.,25.,
14., 7., 3.5, 1.9, 0.95, 0.4, 0.1, 0.03 /)
do nf = 0, nfili-1
fi = addfile (diri+fili(nf), "r")
diro = "./"
filo = "uhelen"+nf+".nc"
print(filo)
system ("/bin/rm -f "+diro+filo) ; remove any pre-exist file
fo = addfile (diro+filo, "c")
hyam = fi->hyam ; read hybrid info
hybm = fi->hybm
hyai = fi->hyai ; read hybrid info
hybi = fi->hybi
PS = fi->PS
P0mb = 0.01*fi->P0
U = fi->U
lat = fi->lat
lev_p!0 = "lev_p" ; variable and dimension name
the same
lev_p&lev_p = lev_p ; create coordinate variable
lev_p@long_name = "pressure" ; attach some attributes
lev_p@units = "hPa"
lev_p@positive = "down"
Up = vinth2p (U, hyam, hybm, lev_p ,PS, 1, P0mb, 2, False)
copy_VarAtts(U, Up)
fo->U = Up ; write to netCDF file
end do
diri = "./"
fili2 = systemfunc("cd "+diri+" ; ls uhelen*nc")
print(fili2)
nfili = dimsizes(fili2)
f2 = addfiles (fili2,"r")
U2= addfiles_GetVar(f2,fili2,"U")
printVarSummary( U2 )
dimt2 = dimsizes( U2 )
ntim2 = dimt2(0)
klvl2 = dimt2(1)
nlat2 = dimt2(2)
mlon2 = dimt2(3)
uavg = dim_avg_Wrap(U2)
uavg_reorder = uavg(lev_p | :, lat | :, time | :) ;
(lev,lat,time)
utimeav = dim_avg_Wrap(uavg_reorder) ; (lev,lat)
;***********************
; Create Plot
;***********************
wks = gsn_open_wks ("pdf", "sebfigc" ) ; open workstation
gsn_define_colormap(wks,"rainbow") ; choose colormap
res = True
res@cnFillOn = True
res@lbLabelAutoStride = True
res@lbOrientation = "Vertical"
res@gsnMaximize = True ; if [ps, eps, pdf] make large
res@gsnSpreadColors = True ; span color map
res@gsnPaperOrientation = "Portrait"
UTIMEAV = conform(uavg_reorder,utimeav,(/0,1/)) ;
(lev,lat,time)
work = utimeav(:,:) ; time average at all levels and
latitudes
res@gsnLeftString = ""
res@gsnRightString = ""
res@pmTitleZone = 3
res@pmLabelBarOrthogonalPosF = 0.05
res@tiXAxisString = "Latitude"
res@tiYAxisString = "Pressure (Pa)"
res@gsnYAxisIrregular2Log = True ; set y-axis to
log scale
res@gsnMajorLatSpacing = 50
res@gsnMinorLatSpacing = 10
res@cnLevelSelectionMode = "ExplicitLevels"
res@cnLevels = (/
-20,-5,0,5,10,15,20,25,30,35,40,45,50,70,100,150 /)
; res@trYReverse = True
; plot = gsn_csm_contour(wks, utimeav(lev_p | 0:20,lat | :),
res ) ; (lev,lat)
plot = gsn_csm_contour(wks, utimeav(lev_p | 20:0,lat | :),
res ) ; (lev,lat)
; plot = gsn_csm_pres_hgt(wks, utimeav(lev_p | 0:20,lat | :),
res ) ; (lev,lat)
end
_______________________________________________
ncl-talk mailing list
List instructions, subscriber options, unsubscribe:
http://mailman.ucar.edu/mailman/listinfo/ncl-talk
This archive was generated by hypermail 2.1.8 : Tue Jan 25 2011 - 14:22:15 MST