Date: Thu Feb 24 2011 - 16:44:19 MST
David-
Thanx for the prompt reply. I really appreciate it. I found a workaround for no decimal
degrees, klugy, but it works for now.
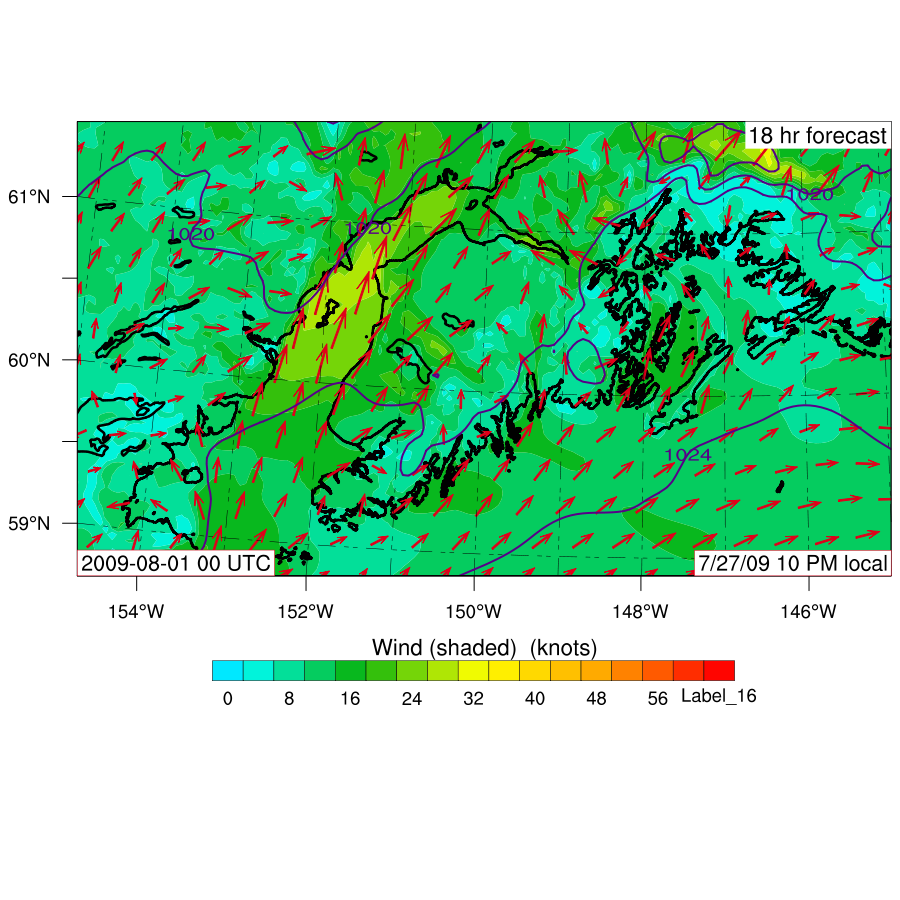
The 16 contour levels still confounds me.
What I need is a color bar/contour levels to span 0kt-> 90kt in 4 kt increments. There
is no way I can get around this requirement.
I tried the cnLevelSelectionMode modes w/ no resolution
My first approach was no explicit mode set and using:
opts_r@ContourParameters = (/ 0.0, 60.0,4 /)
(I have to get 60kts going before I get to 90 kts)
I tossed in your suggestion of
opts_r@cnMaxLevelCount = 25
and got the same result, similar to attached plot.
Next:
opts_r@cnLevelSelectionMode = "AutomaticLevels"
Worst one of the bunch. Scales the levels according to data. No good for animations of
a 48-h forecast when the wind speed changes significantly. My requirement is for a fixed
level increment.
Then:
opts_r@cnLevelSelectionMode = "ExplicitLevels" ;
opts_r@cnLevels = (/ 0., 4., 8., 12., 16., 20., 24., 28., 32., 36., 40., 44., 48.,
52., 56., 60./)
No real difference (this is the attached plot)
Finally:
opts_r@cnLevelSelectionMode = "ManualLevels" ; <-- Manual mode, same problem
opts_r@cnMinLevelValF = 0.0
opts_r@cnMaxLevelValF = 60.0
opts_r@cnLevelSpacingF = 4.0
Seems like this is identical to my original approach, but much more typing.
My script needs to cover at least 95% of the expected conditions in south coastal Alaska
on a year 'round basis... and unfortunately this means surface winds of at least 90 kt.
So. I would appreciate any help you (or your wrf-help brethren) can share.
Thanx, PQO
On Thu, 24 Feb 2011 12:22:23 -0700, David Brown wrote
> Hi Peter,
>
> You are correct that the current implementation of tickmarks for maps is not
> as configurable as we would like. It would be possible, though perhaps not
> particularly easy, to substitute your own TickMark object for the default map
> tickmark. Then you could set up the labels anyway you like.
>
> Regarding 2): the number of colors in the label bar attached to a contour plot
> is controlled by the number of colors used for the contour plot. You can
> increase this in various ways, although I have to say that I do not know
> whether the wrf_contour function takes control of the resources needed to
> control the number of contour levels. If the cnLevelSelectionMode resource is
> set to "AutomaticLevels", then the easiest way to get more levels is to set
> the cnMaxLevelCount to something greater than its default value of 16. Note
> that depending on the actual data range, the number of levels you get may be
> less than cnMaxLevelCount because there is an algorithm to figure out a "nice"
> spacing between contour levels. See the documentation for these resources for
> a more complete explanation. -dave
>
> On Feb 23, 2011, at 8:06 PM, Peter Q. Olsson wrote:
>
> > Hello all-
> >
> > 2 issues I am laying out here, not sure either is solvable (but we can hope!).
> >
> > 1) I would like to have lat/long tick labels on plots [using wrf_contour() &
> > wrf_map_overlays()] that are labeled in DECIMAL DEGREES instead of the default
> > DEG-MIN-SEC. Nosing around in the archives suggests that (at least as of a couple of
> > years ago) this is not an option. Maybe this has changed in the last couple of years...
> >
> > 2) Color bars. I want a color bar w/ about 20 colors (default max seems to be 16). In an
> > attempt to do this, I set the resource:
> >
> > opts_r@lbBoxCount = 20
> >
> > and get back a notification from wrf_contour():
> >
> > warning:lbBoxCount is not a valid resource in proto_contour at this time.
> >
> > I should note that I am using a bunch of other "lb" resources and they all seem to
work.
> >
> > I understand that the "wrf" functions, e.g., wrf_contour() are essentially wrappers for
> > several more primitive ncl functions, making life easier for "wrfies" like myself, at
> > the cost of some of the low-level versatility. Is this the case here? Is there a
> > workaround?
> >
> > Thanx for your help,
> > PQO
> >
> >
> > ___________________________________________________________
> > |
> > | Dr. Peter Q. Olsson,
> > | Alaska State Climatologist, Alaska State Climate Center
> > | Chief Scientist, Alaska Experimental Forecast Facility
> > | University of Alaska Anchorage
> > | 2811 Merrill Field Drive
> > | Anchorage, AK 99501
> > | voice: (907) 786-7234, fax (907) 786-7237|
> >
> > _______________________________________________
> > ncl-talk mailing list
> > List instructions, subscriber options, unsubscribe:
> > http://mailman.ucar.edu/mailman/listinfo/ncl-talk
___________________________________________________________
|
| Dr. Peter Q. Olsson,
| Alaska State Climatologist, Alaska State Climate Center
| Chief Scientist, Alaska Experimental Forecast Facility
| University of Alaska Anchorage
| 2811 Merrill Field Drive
| Anchorage, AK 99501
| voice: (907) 786-7234, fax (907) 786-7237|
------- End of Forwarded Message -------
___________________________________________________________
|
| Dr. Peter Q. Olsson,
| Alaska State Climatologist, Alaska State Climate Center
| Chief Scientist, Alaska Experimental Forecast Facility
| University of Alaska Anchorage
| 2811 Merrill Field Drive
| Anchorage, AK 99501
| voice: (907) 786-7234, fax (907) 786-7237|
_______________________________________________
ncl-talk mailing list
List instructions, subscriber options, unsubscribe:
http://mailman.ucar.edu/mailman/listinfo/ncl-talk