Date: Thu Mar 10 2011 - 02:17:22 MST
Hi everyone,
I am currently trying to plot WRF Wind outputs on a really small domain
with a spatial resolution around 500 meters. I have noticed some weird
behaviour of NCL while plotting wind barbs, and I wonder if I am wrong
with my NCL wind parametrization.
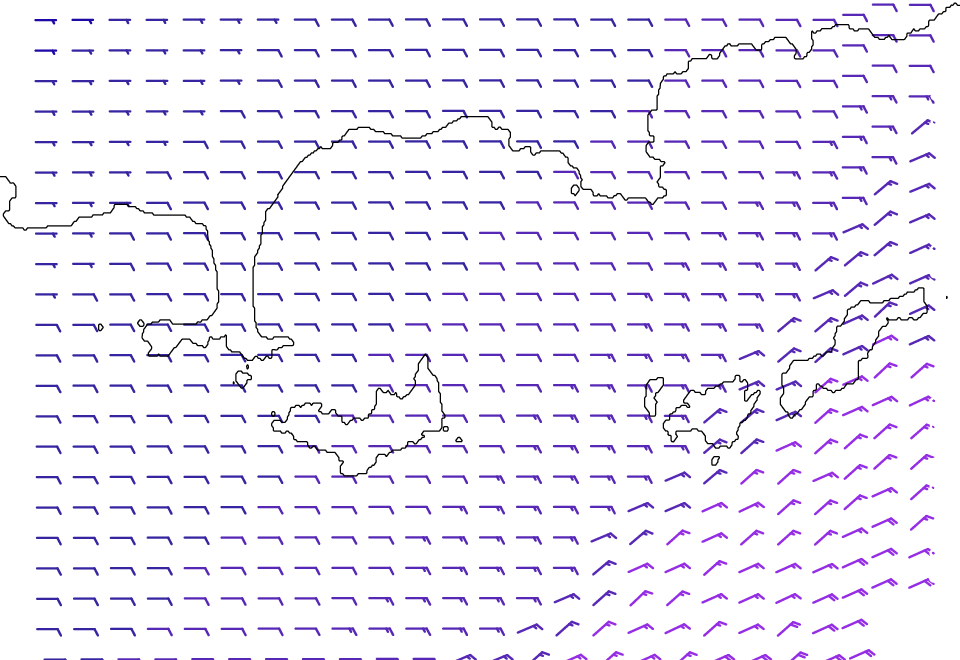
Here is my script, and two similar plots: one with NCL, one with GrADS.
What makes me suspcicious is:
- why this "blank" in the right bottom corner? I have already noticed
this effect on other plots and the blank was even more larger
- why wind barbs layout doesn't seem to respect the mesh? If you look at
the right upper corner, two barbs are shifted upward...
- why wind directions seems so variable? If you take a look at GrADS
plot, directions are smoother while NCL wind barbs look all "unkempt"..
I don't know if I am misusing NCL but the aim is to plot "small-scale"
effects like coastal winds and with this representation we can't even
see the differences between large and coastal wind distribution..
Any help would be appreciated!!
Thanks a lot,
Kind regards,
Caroline
--
load "$NCARG_ROOT/lib/ncarg/nclscripts/csm/gsn_code.ncl"
load "$NCARG_ROOT/lib/ncarg/nclscripts/csm/gsn_csm.ncl"
load "$NCARG_ROOT/lib/ncarg/nclscripts/csm/contributed.ncl"
load "$NCARG_ROOT/lib/ncarg/nclscripts/csm/shea_util.ncl"
;************************************************
begin
v_file="wrfprs_d01.002.grb"
if (.not.isvar("v_file")) then
print("Le nom du fichier source n'est pas defini")
exit()
end if
;************************************************
; read in netCDF file
;************************************************
a = addfile(v_file,"r")
;************************************************
; read in zonal [u] and meridional [v] winds
;************************************************
u = a->U_GRD_GDS3_HTGL_10(:,:)
v = a->V_GRD_GDS3_HTGL_10(:,:)
rot = a->g3_rot_2(:,:)
t = sqrt(u^2+v^2)
uu = (sin(rot)*v + cos(rot)*u)*1.944
vv = (cos(rot)*v - sin(rot)*u)*1.944
lat2d= a->g3_lat_0
lon2d= a->g3_lon_1
dimll = dimsizes(lat2d)
nlon = dimll(0)
nlat = dimll(1)
i_lat_min = 42.9
i_lat_max = 43.2
i_lon_min = 5.8
i_lon_max = 6.6
i_refl = 0.012
i_mindist = 0.015
i_thick = 2
i_space = 0.15
i_length = 0.3
;************************************************
; create plot
;************************************************
wks_type = "ps"
wks =gsn_open_wks(wks_type,"barb")
cmap = RGBtoCmap ("/usr/local/src/ncl/lib/ncarg/colormaps/wind.rgb")
gsn_define_colormap(wks,cmap) ; choose color map
res = True ; plot mods desired
res@gsnMaximize = True
res@gsnPaperOrientation = "landscape"
res@gsnBoxMargin = 0.0
res@gsnSpreadColors = False
res@gsnAddCyclic = False ; regional data
res@lbLabelBarOn = False
res@tmXBOn = False ; don't draw axis nor axis labels
res@tmXTOn = False
res@tmYLOn = False
res@tmYROn = False
res@vcGlyphStyle = "WindBarb" ; choose fill arrows
res@vcRefMagnitudeF = 25. ; make vectors larger
res@vcRefLengthF = i_refl ; ref vec length
res@vcMinDistanceF = i_mindist ; thin out vectors
res@vcWindBarbLineThicknessF = i_thick
res@vcWindBarbTickSpacingF = i_space
res@vcWindBarbTickLengthF = i_length
res@vcMonoWindBarbColor = False
res@vcLevelSelectionMode = "ExplicitLevels"
res@vcLevels=(/0,0.3,1.5,3.3,5.4,7.9,10.7,13.8,17.1,20.7,24.4,28.4,32.6/)
res@vcRefAnnoOn = False ; turn off ref wind barb
; zoom in on map
res@mpDataBaseVersion = "RANGS_GSHHS" ; high resolution coastline
res@mpDataResolution = "FinestResolution"
res@mpFillOn = False
res@mpOutlineOn = "True" ; don't draw map contour
uu@lat2d = lat2d
uu@lon2d = lon2d
vv@lat2d = lat2d
vv@lon2d = lon2d
t@lat2d = lat2d
t@lon2d = lon2d
res@mpProjection = "mercator"
res@mpLimitMode = "Corners"
res@mpLeftCornerLatF = i_lat_min
res@mpLeftCornerLonF = i_lon_min
res@mpRightCornerLatF = i_lat_max
res@mpRightCornerLonF = i_lon_max
plot=gsn_csm_vector_scalar_map(wks,uu,vv,t,res)
end
_______________________________________________
ncl-talk mailing list
List instructions, subscriber options, unsubscribe:
http://mailman.ucar.edu/mailman/listinfo/ncl-talk