Date: Tue Mar 15 2011 - 04:49:22 MDT
Hi, all
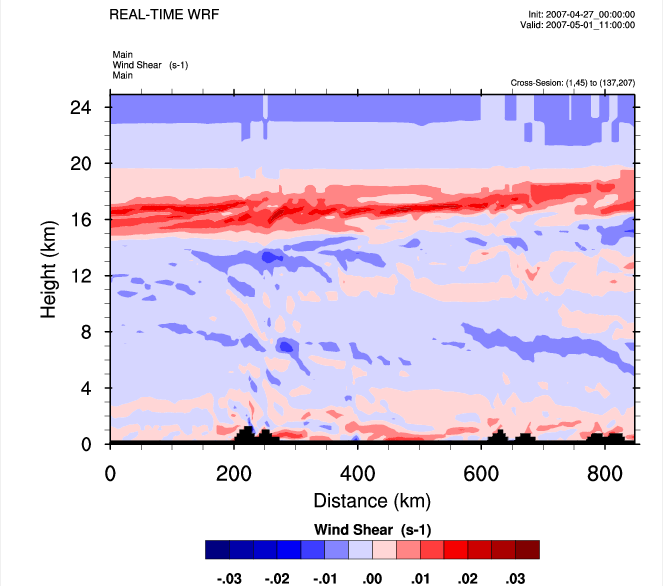
There are two annotation "main" in the top-left of my figure as in the attachment due to this sentence
plot_ter = gsn_csm_xy(wks,ispan(0,844,4),ter_plane,opts_ter)
I try to use
Opts_ter@gsnLeftString = ""
But it does not work. It will be very appreciated if any help.
Best regards,
Guiting
; Example script to produce plots for a WRF real-data run,
; with the ARW coordinate dynamics option.
; Plot data on a cross section
; This script will plot data from a a given point A to point B
; Vertical coordinate is height
load "$NCARG_ROOT/lib/ncarg/nclscripts/csm/gsn_code.ncl"
load "$NCARG_ROOT/lib/ncarg/nclscripts/wrf/WRFUserARW.ncl"
load "$NCARG_ROOT/lib/ncarg/nclscripts/csm/gsn_csm.ncl"
begin
; The WRF ARW input file.
; This needs to have a ".nc" appended, so just do it.
a = addfile("wrfout_d02_2007-05-01_00_00_00.nc","r")
; We generate plots, but what kind do we prefer?
type = "x11"
;type = "png"
;type = "pdf"
type = "ps"
; type = "ncgm"
wks = gsn_open_wks(type,"W/W_CrossSection")
; Set some basic resources
res = True
res@vpWidthF = 1.5 ; overwrite basic plot size
res@vpHeightF = 1.0
pltres = True
;;;;;;;;;;;;;;;;;;;;;;;;;;;;;;;;;;;;;;;;;;;;;;;;;;;;;;;;;;;;;;;;
;;;;;;;;;;;;;;;;;;;;;;;;;;;;;;;;;;;;;;;;;;;;;;;;;;;;;;;;;;;;;;;;
; What times and how many time steps are in the data set?
FirstTime = True
times = wrf_user_list_times(a) ; get times in the file
ntimes = dimsizes(times) ; number of times in the file
ter = wrf_user_getvar(a, "HGT",0)
;;;;;;;;;;;;;;;;;;;;;;;;;;;;;;;;;;;;;;;;;;;;;;;;;;;;;;;;;;;;;;;;
do it = 0,ntimes-1;,2 ; TIME LOOP
print("Working on time: " + times(it) )
; Set Valid time to use on plots
;;;;;;;;;;;;;;;;;;;;;;;;;;;;;;;;;;;;;;;;;;;;;;;;;;;;;;;;;;;;;;;;
; First get the variables we will need
rh = wrf_user_getvar(a,"wa",it) ; w averaged to mass points
z = wrf_user_getvar(a, "z",it) ; grid point height
;;;;;;;;;;;;;;;;;;;;;;;;;;;;;;;;;;;;;;;;;;;;;;;;;;;;;;;;;;;;;;;;;
do ip = 1, 1 ; we are doing 3 plots, specifying different start and end points
; Specify the start and end points of the cross section
; For this case, set opts in wrf_user_intrp3d to True
opts = True
plane = new(4,float)
if(ip .eq. 1) then
plane = (/ 1,45 , 138,208 /) ; approx. start x;y and end x;y point
end if
if(ip .eq. 2) then
plane = (/ 42,1 , 167,210 /) ; approx. start x;y and end x;y point42
end if
if(ip .eq. 3) then
plane = (/ 92,1 , 183,91 /) ; approx. start x;y and end x;y point
end if
; Interpolate data vertically (in z)
ter_plane = wrf_user_intrp2d(ter,plane,0.,opts)/1000.
rh_plane = wrf_user_intrp3d(rh,z,"v",plane,0.,opts)
; Options for XY Plots
opts_xy = res
opts_xy@tiXAxisString = "Distance (km)"
opts_xy@tiYAxisString = "Height (km)"
opts_xy@tiXAxisFontHeightF = 0.040
opts_xy@tiYAxisFontHeightF = 0.040
opts_xy@tmXBMajorLengthF = 0.02
opts_xy@tmYLMajorLengthF = 0.02
opts_xy@tmYLLabelFontHeightF = 0.04
; Plotting options for W
gsn_define_colormap(wks,"BlWhRe")
opts_rh = opts_xy
opts_rh@MainTitle = "REAL-TIME WRF"
opts_rh@TimeLabel = times(it)
opts_rh@pmLabelBarOrthogonalPosF = -0.27
opts_rh@ContourParameters = (/ -3., 3., 0.25 /)
opts_rh@cnFillOn = True
opts_rh@lbAutoManage=False
opts_rh@pmLabelBarOrthogonalPosF = -0.15
opts_rh@lbLabelFont = "Helvetica-Bold"
opts_rh@lbLabelFontHeightF =0.03
opts_rh@lbTitleFont = "Helvetica-Bold"
opts_rh@lbTitleFontHeightF =0.03
opts_rh@cnMissingValPerimOn = True
opts_rh@cnMissingValFillColor = "black"
opts_rh@cnMissingValFillPattern = 0
; Plotting options for terrain
opts_ter=opts_xy
opts_ter@gsnXYBarChart = True
opts_ter@gsnXYBarChartColors= "black"
opts_ter@gsnYRefLine = 0
opts_ter@gsnAboveYRefLineColor = "black"
opts_ter@gsnXYBarChartPatterns = 0
opts_ter@gsnDraw = False
opts_ter@gsnFrame = False
opts_ter@trYMinF = 0.
opts_ter@trYMaxF = 24.9
opts_ter@trXMinF = 0.
opts_ter@trXMaxF = xmax
plot_ter = gsn_csm_xy(wks,ispan(0,844,4),ter_plane,opts_ter)
plot_ter2= gsn_csm_xy(wks,ispan(0,844,4),ter_plane,opts_ter)
; Get the contour info for the rh and temp
contour_rh = wrf_contour(a,wks,rh_plane(1:98,:),opts_rh)
; MAKE PLOTS
plot = wrf_overlays(a,wks,(/plot_ter,contour_rh,plot_ter2/),pltres)
; Delete options and fields, so we don't have carry over
delete(opts_rh)
delete(rh_plane)
end do ; make next cross section
;;;;;;;;;;;;;;;;;;;;;;;;;;;;;;;;;;;;;;;;;;;;;;;;;;;;;;;;;;;;;;;;
end do ; END OF TIME LOOP
end
________________________________
CONFIDENTIALITY: This email is intended solely for the person(s) named and may be confidential and/or privileged. If you are not the intended recipient, please delete it, notify us and do not copy, use, or disclose its content. Thank you.
Towards A Sustainable Earth: Print Only When Necessary
_______________________________________________
ncl-talk mailing list
List instructions, subscriber options, unsubscribe:
http://mailman.ucar.edu/mailman/listinfo/ncl-talk