Date: Thu Apr 14 2011 - 15:49:55 MDT
Hi Ed,
I already had NCEP/NCAR data here so I was able to run your script. I
get contours everywhere, as is evident in the attached images.
If you continue to have issues with vectors, I would strongly suggest
removing most (if not all) of your vector resource list to simplify
things, and slowly add them back in.
So you know, you can compress the following section of your code:
slp1959=dim_avg_n(slp(131:137,:,:),0)
slp1960=dim_avg_n(slp(143:149,:,:),0)
slp1961=dim_avg_n(slp(155:161,:,:),0)
.......
slp2009=dim_avg_n(slp(731:737,:,:),0)
slp2010=dim_avg_n(slp(743:749,:,:),0)
to something like this: (untested)
slp_annavg = slp(134::12,:,:) ; preallocate space for new array
slp_annavg = slp_annavg@_FillValue ; fill with _FillValue
delete(slp_annavg&time) ; remove time coordinate variable
slp_annavg&time = ispan(1959,2010,1) ; and replace it
cntr = 131
do gg = 0,51
slp_ann_avg(gg,:,:) = (/ dim_avg_n(slp(cntr:cntr+6,:,:),0) /)
cntr = cntr+12
end do
You can then refer to slp1959 as slp({1959},:,:), slp2000 as
slp({2000},:,:), and so on. I could have made the coding more generic,
but it's easier to follow this way.
Anyway, hope that helps! Adam
On 04/13/2011 01:14 PM, Ed Martino wrote:
> Mary and others
>
> A few months ago I wrote an ncl script to plot slp anomalies as contours
> and wind anomalies as overlayed vectors. I use this script on NCEP
> monthly slp and wind reanalysis data. My original script runs fine when
> using surface wind vector data. I would like to conduct the same
> analysis using wind vector data that includes pressure levels, to
> evaluate wind vector anomalies above the surface.
>
> Thanks to Mary Fraley's help I've solved some of the problems I was
> having with vector resources. The script copied below plots slp
> anomalies as contours and overlays wind vectors at a pressure
> level=150mbar. However, wind vectors are not plotting at all
> locations. Wind vectors are not plotted between latitude 25 and 50
> degrees north. Vectors plot nicely at all locations when I use NCEP
> reanalysis surface wind data (uwnd.mon.mean.nc) but not when I import
> wind data for different pressure levels (uwnd.mon.mean.p.nc), and make
> appropriate modifications to the script to select winds at a particular
> pressure level.
>
> Is the problem a result of large differences in wind vector magnitude
> across locations at a specific pressure level (i.e. 150mbar)?
> If my primary goal is to evaluate winds associated with the jet stream
> is there a better data set to use?
>
> Thanks and please excuse my ignorance, I'm a meteorology newbie.
>
> Ed
>
> ***************
> *** ncl script ***
>
> load "$NCARG_ROOT/lib/ncarg/nclscripts/csm/gsn_code.ncl"
> load "$NCARG_ROOT/lib/ncarg/nclscripts/csm/gsn_csm.ncl"
>
> begin
>
> ; open netcdf files
> slp_file=addfile("slp.mon.mean.nc","r")
> u_file=addfile("uwnd.mon.mean.p.nc", "r")
> v_file=addfile("vwnd.mon.mean.p.nc", "r")
>
> ;NOTE the wind and slp files are both monthly mean files
> ;from the NCEP Reanalysis files thus no time/date conversions necessary
>
> time=slp_file->time ;; read the variables from files
> slp=slp_file->slp
> lat=slp_file->lat
> lon=slp_file->lon
>
> u=u_file->uwnd
> lev=u_file->level
> lat=u_file->lat
> lon=u_file->lon
>
> v=v_file->vwnd
> lev=v_file->level
> lat=v_file->lat
> lon=v_file->lon
>
> utc_date = ut_calendar(time(12), -5) ;; use "ut_calender" to check
> the date in year, month,
> print(utc_date) ;; day format, given the the index of the
> "time" variable.
>
> slp1959=dim_avg_n(slp(131:137,:,:),0)
> slp1960=dim_avg_n(slp(143:149,:,:),0)
> slp1961=dim_avg_n(slp(155:161,:,:),0)
> slp1962=dim_avg_n(slp(167:173,:,:),0)
> slp1963=dim_avg_n(slp(179:185,:,:),0)
> slp1964=dim_avg_n(slp(191:197,:,:),0)
> slp1965=dim_avg_n(slp(203:209,:,:),0)
> slp1966=dim_avg_n(slp(215:221,:,:),0) ;; average the Dec-June slp for
> each year of interest
> slp1967=dim_avg_n(slp(227:233,:,:),0)
> slp1968=dim_avg_n(slp(239:245,:,:),0)
> slp1969=dim_avg_n(slp(251:257,:,:),0)
> slp1970=dim_avg_n(slp(263:269,:,:),0) ;; using the "dim_avg_n" function
> slp1971=dim_avg_n(slp(275:281,:,:),0)
> slp1972=dim_avg_n(slp(287:293,:,:),0)
> slp1973=dim_avg_n(slp(299:305,:,:),0)
> slp1974=dim_avg_n(slp(311:317,:,:),0)
> slp1975=dim_avg_n(slp(323:329,:,:),0)
> slp1976=dim_avg_n(slp(335:341,:,:),0)
> slp1977=dim_avg_n(slp(347:353,:,:),0)
> slp1978=dim_avg_n(slp(359:365,:,:),0)
> slp1979=dim_avg_n(slp(371:377,:,:),0)
> slp1980=dim_avg_n(slp(383:389,:,:),0)
> slp1981=dim_avg_n(slp(395:401,:,:),0)
> slp1982=dim_avg_n(slp(407:413,:,:),0)
> slp1983=dim_avg_n(slp(419:425,:,:),0)
> slp1984=dim_avg_n(slp(431:437,:,:),0)
> slp1985=dim_avg_n(slp(443:449,:,:),0)
> slp1986=dim_avg_n(slp(455:461,:,:),0)
> slp1987=dim_avg_n(slp(467:473,:,:),0)
> slp1988=dim_avg_n(slp(479:485,:,:),0)
> slp1989=dim_avg_n(slp(491:497,:,:),0)
> slp1990=dim_avg_n(slp(503:509,:,:),0)
> slp1991=dim_avg_n(slp(515:521,:,:),0)
> slp1992=dim_avg_n(slp(527:533,:,:),0)
> slp1993=dim_avg_n(slp(539:545,:,:),0) ;; averaging months for all years
> slp1994=dim_avg_n(slp(551:557,:,:),0) ;; for anomaly calculation
> slp1995=dim_avg_n(slp(563:569,:,:),0) ;; NOTE should we only use
> years when fish data?
> slp1996=dim_avg_n(slp(575:581,:,:),0) ;; or available years? ESRL
> online tool?
> slp1997=dim_avg_n(slp(587:593,:,:),0)
> slp1998=dim_avg_n(slp(599:605,:,:),0)
> slp1999=dim_avg_n(slp(611:617,:,:),0)
> slp2000=dim_avg_n(slp(623:629,:,:),0)
> slp2001=dim_avg_n(slp(635:641,:,:),0)
> slp2002=dim_avg_n(slp(647:653,:,:),0)
> slp2003=dim_avg_n(slp(659:665,:,:),0)
> slp2004=dim_avg_n(slp(671:677,:,:),0)
> slp2005=dim_avg_n(slp(683:689,:,:),0)
> slp2006=dim_avg_n(slp(695:701,:,:),0)
> slp2007=dim_avg_n(slp(707:713,:,:),0)
> slp2008=dim_avg_n(slp(719:725,:,:),0)
> slp2009=dim_avg_n(slp(731:737,:,:),0)
> slp2010=dim_avg_n(slp(743:749,:,:),0)
>
> u1959=dim_avg_n(u(131:137,10,:,:),0)
> u1960=dim_avg_n(u(143:149,10,:,:),0)
> u1961=dim_avg_n(u(155:161,10,:,:),0)
> u1962=dim_avg_n(u(167:173,10,:,:),0)
> u1963=dim_avg_n(u(179:185,10,:,:),0)
> u1964=dim_avg_n(u(191:197,10,:,:),0)
> u1965=dim_avg_n(u(203:209,10,:,:),0)
> u1966=dim_avg_n(u(215:221,10,:,:),0) ;; average the Dec-June u for
> each year of interest
> u1967=dim_avg_n(u(227:233,10,:,:),0)
> u1968=dim_avg_n(u(239:245,10,:,:),0)
> u1969=dim_avg_n(u(251:257,10,:,:),0)
> u1970=dim_avg_n(u(263:269,10,:,:),0) ;; using the "dim_avg_n" function
> u1971=dim_avg_n(u(275:281,10,:,:),0)
> u1972=dim_avg_n(u(287:293,10,:,:),0)
> u1973=dim_avg_n(u(299:305,10,:,:),0)
> u1974=dim_avg_n(u(311:317,10,:,:),0)
> u1975=dim_avg_n(u(323:329,10,:,:),0)
> u1976=dim_avg_n(u(335:341,10,:,:),0)
> u1977=dim_avg_n(u(347:353,10,:,:),0)
> u1978=dim_avg_n(u(359:365,10,:,:),0)
> u1979=dim_avg_n(u(371:377,10,:,:),0)
> u1980=dim_avg_n(u(383:389,10,:,:),0)
> u1981=dim_avg_n(u(395:401,10,:,:),0)
> u1982=dim_avg_n(u(407:413,10,:,:),0)
> u1983=dim_avg_n(u(419:425,10,:,:),0)
> u1984=dim_avg_n(u(431:437,10,:,:),0)
> u1985=dim_avg_n(u(443:449,10,:,:),0)
> u1986=dim_avg_n(u(455:461,10,:,:),0)
> u1987=dim_avg_n(u(467:473,10,:,:),0)
> u1988=dim_avg_n(u(479:485,10,:,:),0)
> u1989=dim_avg_n(u(491:497,10,:,:),0)
> u1990=dim_avg_n(u(503:509,10,:,:),0)
> u1991=dim_avg_n(u(515:521,10,:,:),0)
> u1992=dim_avg_n(u(527:533,10,:,:),0)
> u1993=dim_avg_n(u(539:545,10,:,:),0) ;; averaging months for all years
> u1994=dim_avg_n(u(551:557,10,:,:),0) ;; for anomaly calculation
> u1995=dim_avg_n(u(563:569,10,:,:),0) ;; NOTE should we only use years
> when fish data?
> u1996=dim_avg_n(u(575:581,10,:,:),0) ;; or available years? ESRL
> online tool?
> u1997=dim_avg_n(u(587:593,10,:,:),0)
> u1998=dim_avg_n(u(599:605,10,:,:),0)
> u1999=dim_avg_n(u(611:617,10,:,:),0)
> u2000=dim_avg_n(u(623:629,10,:,:),0)
> u2001=dim_avg_n(u(635:641,10,:,:),0)
> u2002=dim_avg_n(u(647:653,10,:,:),0)
> u2003=dim_avg_n(u(659:665,10,:,:),0)
> u2004=dim_avg_n(u(671:677,10,:,:),0)
> u2005=dim_avg_n(u(683:689,10,:,:),0)
> u2006=dim_avg_n(u(695:701,10,:,:),0)
> u2007=dim_avg_n(u(707:713,10,:,:),0)
> u2008=dim_avg_n(u(719:725,10,:,:),0)
> u2009=dim_avg_n(u(731:737,10,:,:),0)
> u2010=dim_avg_n(u(743:749,10,:,:),0)
>
> v1959=dim_avg_n(v(131:137,10,:,:),0)
> v1960=dim_avg_n(v(143:149,10,:,:),0)
> v1961=dim_avg_n(v(155:161,10,:,:),0)
> v1962=dim_avg_n(v(167:173,10,:,:),0)
> v1963=dim_avg_n(v(179:185,10,:,:),0)
> v1964=dim_avg_n(v(191:197,10,:,:),0)
> v1965=dim_avg_n(v(203:209,10,:,:),0)
> v1966=dim_avg_n(v(215:221,10,:,:),0) ;; average the Dec-Jvne v for
> each year of interest
> v1967=dim_avg_n(v(227:233,10,:,:),0)
> v1968=dim_avg_n(v(239:245,10,:,:),0)
> v1969=dim_avg_n(v(251:257,10,:,:),0)
> v1970=dim_avg_n(v(263:269,10,:,:),0) ;; vsing the "dim_avg_n" fvnction
> v1971=dim_avg_n(v(275:281,10,:,:),0)
> v1972=dim_avg_n(v(287:293,10,:,:),0)
> v1973=dim_avg_n(v(299:305,10,:,:),0)
> v1974=dim_avg_n(v(311:317,10,:,:),0)
> v1975=dim_avg_n(v(323:329,10,:,:),0)
> v1976=dim_avg_n(v(335:341,10,:,:),0)
> v1977=dim_avg_n(v(347:353,10,:,:),0)
> v1978=dim_avg_n(v(359:365,10,:,:),0)
> v1979=dim_avg_n(v(371:377,10,:,:),0)
> v1980=dim_avg_n(v(383:389,10,:,:),0)
> v1981=dim_avg_n(v(395:401,10,:,:),0)
> v1982=dim_avg_n(v(407:413,10,:,:),0)
> v1983=dim_avg_n(v(419:425,10,:,:),0)
> v1984=dim_avg_n(v(431:437,10,:,:),0)
> v1985=dim_avg_n(v(443:449,10,:,:),0)
> v1986=dim_avg_n(v(455:461,10,:,:),0)
> v1987=dim_avg_n(v(467:473,10,:,:),0)
> v1988=dim_avg_n(v(479:485,10,:,:),0)
> v1989=dim_avg_n(v(491:497,10,:,:),0)
> v1990=dim_avg_n(v(503:509,10,:,:),0)
> v1991=dim_avg_n(v(515:521,10,:,:),0)
> v1992=dim_avg_n(v(527:533,10,:,:),0)
> v1993=dim_avg_n(v(539:545,10,:,:),0) ;; averaging months for all years
> v1994=dim_avg_n(v(551:557,10,:,:),0) ;; for anomaly calculation
> v1995=dim_avg_n(v(563:569,10,:,:),0)
> v1996=dim_avg_n(v(575:581,10,:,:),0)
> v1997=dim_avg_n(v(587:593,10,:,:),0)
> v1998=dim_avg_n(v(599:605,10,:,:),0)
> v1999=dim_avg_n(v(611:617,10,:,:),0)
> v2000=dim_avg_n(v(623:629,10,:,:),0)
> v2001=dim_avg_n(v(635:641,10,:,:),0)
> v2002=dim_avg_n(v(647:653,10,:,:),0)
> v2003=dim_avg_n(v(659:665,10,:,:),0)
> v2004=dim_avg_n(v(671:677,10,:,:),0)
> v2005=dim_avg_n(v(683:689,10,:,:),0)
> v2006=dim_avg_n(v(695:701,10,:,:),0)
> v2007=dim_avg_n(v(707:713,10,:,:),0)
> v2008=dim_avg_n(v(719:725,10,:,:),0)
> v2009=dim_avg_n(v(731:737,10,:,:),0)
> v2010=dim_avg_n(v(743:749,10,:,:),0)
>
> slp_sbass =
> (slp1966+slp1970+slp1993+slp1994+slp1996+slp1998+slp1999+slp2000+slp2001+slp2003+slp2005)/11
>
> slp_all_years(slp1961+slp1962+slp1963+slp1964+slp1965+slp1966+slp1967+slp1968+slp1969+slp1970+slp1971+slp1972+slp1973+slp1974+slp1975+slp1976+slp1977+slp1978+slp1979+slp1980+slp1981+slp1982+slp1983+slp1984+slp1985+slp1986+slp1987+slp1988+slp1989+slp1990)/30
> slp_anom = (slp_sbass - slp_all_years)
>
> u_sbass =
> (u1966+u1970+u1993+u1994+u1996+u1998+u1999+u2000+u2001+u2003+u2005)/11
> u_all_years=u1961+u1962+u1963+u1964+u1965+u1966+u1967+u1968+u1969+u1970+u1971+u1972+u1973+u1974+u1975+u1976+u1977+u1978+u1979+u1980+u1981+u1982+u1983+u1984+u1985+u1986+u1987+u1988+u1989+u1990)/30
> u_anom = (u_sbass - u_all_years)
>
> v_sbass =
> (v1966+v1970+v1993+v1994+v1996+v1998+v1999+v2000+v2001+v2003+v2005)/11
> v_all_years(v1961+v1962+v1963+v1964+v1965+v1966+v1967+v1968+v1969+v1970+v1971+v1972+v1973+v1974+v1975+v1976+v1977+v1978+v1979+v1980+v1981+v1982+v1983+v1984+v1985+v1986+v1987+v1988+v1989+v1990)/30
> v_anom = (v_sbass - v_all_years)
>
>
> ; Ordered 0 to 16 Pressure levels in NCEP reanalys wind data sets
> ; Isobaric surface: 1000 mbar 1948-01-01 00:00 to 2011-03-01 00:00
> ; Isobaric surface: 925 mbar 1948-01-01 00:00 to 2011-03-01 00:00
> ; Isobaric surface: 850 mbar 1948-01-01 00:00 to 2011-03-01 00:00
> ; Isobaric surface: 700 mbar 1948-01-01 00:00 to 2011-03-01 00:00
> ; Isobaric surface: 600 mbar 1948-01-01 00:00 to 2011-03-01 00:00
> ; Isobaric surface: 500 mbar 1948-01-01 00:00 to 2011-03-01 00:00
> ; Isobaric surface: 400 mbar 1948-01-01 00:00 to 2011-03-01 00:00
> ; Isobaric surface: 300 mbar 1948-01-01 00:00 to 2011-03-01 00:00
> ; Isobaric surface: 250 mbar 1948-01-01 00:00 to 2011-03-01 00:00
> ; Isobaric surface: 200 mbar 1948-01-01 00:00 to 2011-03-01 00:00
> ; Isobaric surface: 150 mbar 1948-01-01 00:00 to 2011-03-01 00:00
> ; Isobaric surface: 100 mbar 1948-01-01 00:00 to 2011-03-01 00:00
> ; Isobaric surface: 70 mbar 1948-01-01 00:00 to 2011-03-01 00:00
> ; Isobaric surface: 50 mbar 1948-01-01 00:00 to 2011-03-01 00:00
> ; Isobaric surface: 30 mbar 1948-01-01 00:00 to 2011-03-01 00:00
> ; Isobaric surface: 20 mbar 1948-01-01 00:00 to 2011-03-01 00:00
> ; Isobaric surface: 10 mbar 1948-01-01 00:00 to 2011-03-01 00:00
>
>
> slp_anom!0="lat" ;; Assign lat and lon coordinates to slp_anom to
> enable plotting
> slp_anom!1="lon"
> slp_anom&lat=lat
> slp_anom&lon=lon
>
> u_anom!0="lat" ;; Assign lat and lon coordinates to u_anom to enable
> plotting
> u_anom!1="lon"
> u_anom&lat=lat
> u_anom&lon=lon
>
> v_anom!0="lat" ;; Assign lat and lon coordinates to v_anom to enable
> plotting
> v_anom!1="lon"
> v_anom&lat=lat
> v_anom&lon=lon
>
>
> ;; Variable summaries
>
> printVarSummary(slp_anom)
> print("min/max slp_anom = " + min(slp_anom) + "/" + max(slp_anom))
>
> printVarSummary(u_anom)
> print("min/max u_anom = " + min(u_anom) + "/" + max(u_anom))
>
> printVarSummary(v_anom)
> print("min/max v_anom = " + min(v_anom) + "/" + max(v_anom))
>
>
> wks = gsn_open_wks("X11","slp_anom") ;; Open graphic workstation for
> xwindow or file output
>
> ;******** Define RGB triplet colors
> colors = (/ (/255, 255,255/),
>
> (/15,10,120/),(/20,30,155/),(/25,55,180/),(/28,65,197/),(/29,75,200/), \
> (/28,78,200/),(/28,80,210/),(/30,85,210/),(/30,95,215/),(/32,100,220/),(/32,102,220/),(/35,105,228/)
> ,(/35,115,228/), \
>
> (/37,125,230/),(/37,135,230/),(/37,155,230/),(/38,165,231/),(/38,175,231/),(/39,180,233/),(/39,185,233/),(/40,190,233/),
> \
> (/50,205,232/),(/120,230,245/),(/180,240,255/), \
> (/255, 255,255/),(/255, 255,255/), (/255, 255,255/), \
> (/250,
> 245,175/),(/250,235,165/),(/245,235,165/),(/245,225,155/),(/243,220,140/), \
> (/243,
> 218,135/),(/242,212,125/),(/240,210,118/),(/240,205,115/),(/238,204,112/),(/238,200,108/),
> \
> (/235,
> 200,108/),(/235,185,105/),(/225,180,103/),(/220,175,85/),(/220,150,75/),(/215,130,60/),
> \
>
> (/215,125,55/),(/215,100,45/),(/218,90,45/),(/210,70,35/),(/200,60,15/),
> (/195,55,10/)\
> /) * 1.0 ; we
> multiply by 1.0 to make colors float
> colors = colors/255. ;
> normalize (required by NCL)
>
> gsn_define_colormap(wks, colors) ;
>
> res = True
> res@gsnDraw = False
> res@gsnFrame = False
> vcres = res
> mpres = res
>
>
> res@cnFillOn = True ; turn on color fill
> res@lbLabelAutoStride = True ; automatically choose best stride
> res@gsnStringFontHeightF = 0.25
> res@cnLevelSpacingF = 0.2
> res@gsnSpreadColors = True
> res@gsnMaximize = True
> res@gsnPaperOrientation = "auto"
> res@lbLabelAngleF = 45
> res@pmLabelBarOrthogonalPosF = 0.05
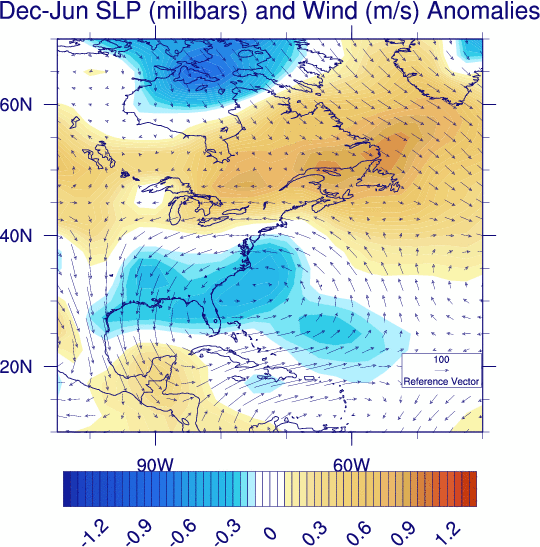
> res@tiMainString = "Dec-Jun SLP (millbars) and Wind (m/s)
> Anomalies"
> res@cnLevelSelectionMode = "ExplicitLevels" ; set explicit
> contour levels
> res@cnLevels = (/
> -1.35,-1.30,-1.25,-1.20,-1.15,-1.10,-1.05,-1.0,-0.95,-0.90,-0.85,-0.80,-0.75,-0.70,-0.65,-0.60,-0.55
> ,-0.50,-0.45,-0.40, \
> -0.35,-0.30,-0.25,-0.20,-0.15,-0.10,-0.05, 0,
> 0.05,0.10,0.15,0.20,0.25,0.30,0.35,0.40,0.45,0.50,0.55,0.60,0.65,0.70,0.75,0.80,0.85,
> \
> 0.90,0.95,1.0,1.05,1.10,1.15,1.20,1.25,1.30,1.35
> /) ; set levels
> res@cnLinesOn = False ; turn off the contour lines
> res@cnFillDrawOrder = "Predraw"
>
> ; Set up some vector resources.
>
> ; vcres@vcLevelSelectionMode = "ManualLevels"
> vcres@gsnMaximize = True
> vcres@gsnPaperOrientation = "portrait"
> ; vcres@vcMinLevelValF = -425.0
> ; vcres@vcMaxLevelValF = 425.0
> vcres@vcLevelSpacingF = 50.0
> ; vcres@gsnSpreadColors = False
> ; vcres@gsnSpreadColorEnd = 3
> vcres@vcGlyphStyle = "LineArrow"
> ; vcres@vcFillArrowsOn = False
> vcres@vcLineArrowColor = -1
> vcres@vcFillArrowFillColor = -1
> vcres@vcFillArrowEdgeColor = -1
> vcres@vcLineArrowThicknessF = 0.50
> vcres@vcMinFracLengthF = 0.0001
> vcres@vcMinMagnitudeF = 0.0
> vcres@vcRefLengthF = 0.02
> vcres@vcRefMagnitudeF = 100.0
> vcres@vcRefAnnoOrthogonalPosF = -0.55
> vcres@vcRefAnnoParallelPosF = 0.997
> vcres@vcRefAnnoFontHeightF = 0.010
> vcres@lbTitleString = "Pres Level Wind Anomaly"
> vcres@lbTitleOffsetF = -1.50
> vcres@lbTitleFontHeightF = 0.005
> vcres@lbLabelFontHeightF = 0.005
> vcres@lbLabelAutoStride = True
> vcres@vcLineArrowHeadMinSizeF = 0.005
> vcres@vcLineArrowHeadMaxSizeF = 0.005
>
> ;
> ; Make sure vectors are drawn in "predraw" phase.
> ;
>
> vcres@vcVectorDrawOrder = "Predraw"
>
>
> ; Control appearance of map.
> ;
> ; mpres@mpProjection = "LambertEqualArea"
> mpres@mpDataBaseVersion = "MediumRes"
> ; mpres@gsnMaximize = True
> mpres@gsnPaperOrientation = "portrait"
> mpres@mpLabelsOn = False
> mpres@mpPerimOn = True
> mpres@mpGridAndLimbOn = False
> mpres@mpFillOn = False
> mpres@mpOutlineOn = True
> mpres@mpOutlineDrawOrder = "PostDraw"
> mpres@mpFillDrawOrder = "Predraw"
> mpres@mpOceanFillColor = 9
> mpres@mpLandFillColor = 43
> mpres@mpGeophysicalLineThicknessF = 1.5
>
> ;
> ; Zoom in on area
> ;
> mpres@mpLimitMode = "LatLon"
> mpres@mpMinLatF = 10.
> mpres@mpMaxLatF = 70.
> mpres@mpMinLonF = -105.
> mpres@mpMaxLonF = -40.
>
> ; Use "overlay" to overlay anomalies for slp and wind
>
> ; slpanom = gsn_csm_contour(wks,slp_anom,res)
> ; windanom = gsn_csm_vector_map(wks,u_anom, v_anom,res2)
>
> slpanom = gsn_csm_contour(wks,slp_anom,res)
> windanom = gsn_csm_vector(wks,u_anom, v_anom,vcres)
> mpid = gsn_csm_map(wks,mpres)
>
> ; Overlay contour and vector plots on the map plot.
>
> overlay(mpid,slpanom)
> overlay(mpid,windanom)
>
> ; Draw to Xwindow
> maximize_output(wks, True)
>
>
> wks2=gsn_open_wks("ps","slp_wind_anom_sbass")
> gsn_define_colormap(wks2, colors)
>
> slpanom = gsn_csm_contour(wks2,slp_anom,res)
> windanom = gsn_csm_vector(wks2,u_anom, v_anom,vcres)
> mpid = gsn_csm_map(wks2,mpres)
>
> ; Overlay contour and vector plots on the map plot.
>
> overlay(mpid,slpanom)
> overlay(mpid,windanom)
>
> ; Export Plot
> maximize_output(wks2, True)
>
> end
>
>
>
>
> On 4/13/2011 2:00 PM, ncl-talk-request@ucar.edu wrote:
>> Send ncl-talk mailing list submissions to
>> ncl-talk@ucar.edu
>>
>> To subscribe or unsubscribe via the World Wide Web, visit
>> http://mailman.ucar.edu/mailman/listinfo/ncl-talk
>> or, via email, send a message with subject or body 'help' to
>> ncl-talk-request@ucar.edu
>>
>> You can reach the person managing the list at
>> ncl-talk-owner@ucar.edu
>>
>> When replying, please edit your Subject line so it is more specific
>> than "Re: Contents of ncl-talk digest..."
>>
>>
>> Today's Topics:
>>
>> 1. Re: Map + histogram (Andrea Hahmann)
>> 2. tornado track (Avel O)
>> 3. Re: Map + histogram (Adam Phillips)
>> 4. Re: Defining large arrays (Adam Phillips)
>>
>>
>> ----------------------------------------------------------------------
>>
>> Message: 1
>> Date: Wed, 13 Apr 2011 13:36:54 +0200
>> From: Andrea Hahmann<ahah@risoe.dtu.dk>
>> Subject: Re: Map + histogram
>> To: louis Vonder<appopson@yahoo.fr>, ncl forum<ncl-talk@ucar.edu>
>> Message-ID:<C9CB5776.10FC0%ahah@exchange.risoe.dk>
>> Content-Type: text/plain; charset="iso-8859-1"
>>
>> Dear Louis
>>
>> I have created similar figures, but trying to get the plots in the right
>> place was too much trouble. How about using adobe illustrator (or gimp,
>> xfig etc.)? Then you will have a lot of control on the size, position, etc
>> of the various pieces. Unless you have dozens of these to make...
>>
>> Just my two cents,
>>
>> Regards,
>> Andrea
> _______________________________________________
> ncl-talk mailing list
> List instructions, subscriber options, unsubscribe:
> http://mailman.ucar.edu/mailman/listinfo/ncl-talk
--
__________________________________________________
Adam Phillips
asphilli@ucar.edu
National Center for Atmospheric Research   tel: (303) 497-1726
Climate and Global Dynamics Division         fax: (303) 497-1333
P.O. Box 3000
Boulder, CO 80307-3000    http://www.cgd.ucar.edu/cas/asphilli
_______________________________________________
ncl-talk mailing list
List instructions, subscriber options, unsubscribe:
http://mailman.ucar.edu/mailman/listinfo/ncl-talk